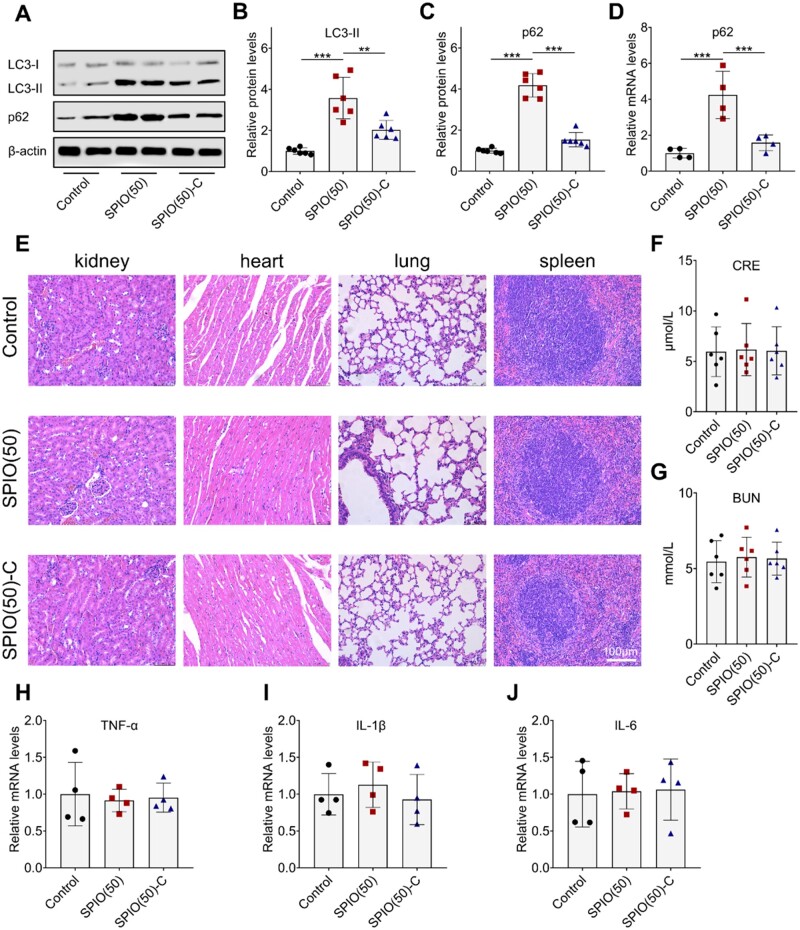
Figure 7.
In vivo evaluation of SPIO nanoparticles. (A) Western blot analysis of LC3 and p62 in the liver treated with SPIO nanoparticles for 24 h, β-actin was detected as a loading control. Densitometry analysis for quantifying the levels of LC3-II (B) and p62 (C). (D) RT-qPCR analysis of p62 in the liver. (E) HE staining of the sections of kidney, heart, lung and spleen. Evaluation of CRE (F) and BUN (G) to determine the degree of kidney injury. RT-qPCR test of TNF-α (H), IL-1β (I) and IL-6 (J) in the kidney. Values are expressed as the mean, n ≥ 4. Bars show SD. **P < 0.01; ***P < 0.001

