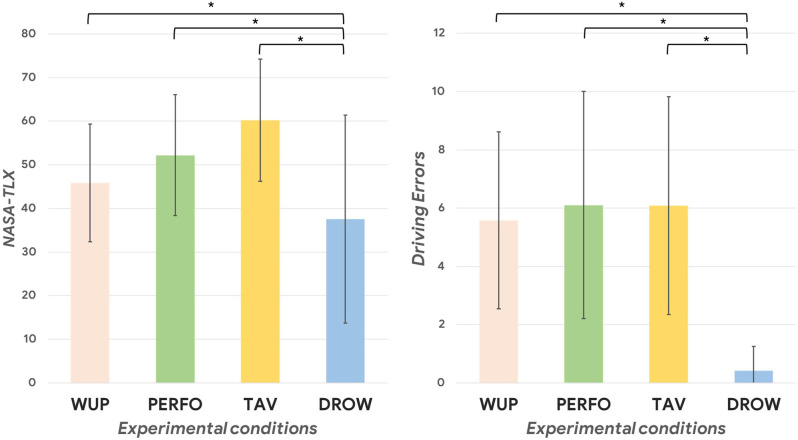
Figure 2.
On the left, the difference in terms of perceived difficulty (mental workload score obtained from the NASA-TLX questionnaire filled at the end of each driving task) of the performed task during the different experimental conditions (all p < 0.01). On the right, the statistical decrease of driving errors during the DROW condition compared to the others can be observed (all p < 0.01). The asterisk(s) indicate whether the post-hoc paired tests are significant (p < 0.05).

