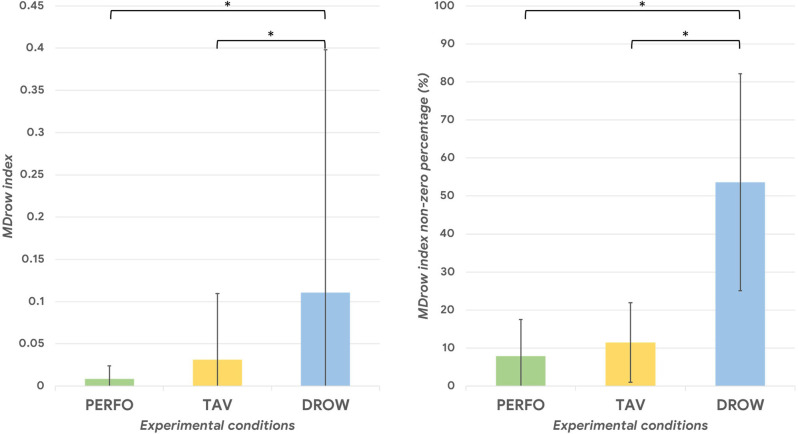
Figure 8.
Onthe left, the MDrow index was significantly higher during the DROW condition (all p < 0.01). On the right, the MDrow index was higher than zero in more than 50% during the DROW condition, while its non-zero percentage was lower than 12% during the TAV and PERFO conditions. The asterisk(s) indicate whether the post-hoc paired tests are significant (p < 0.05).

