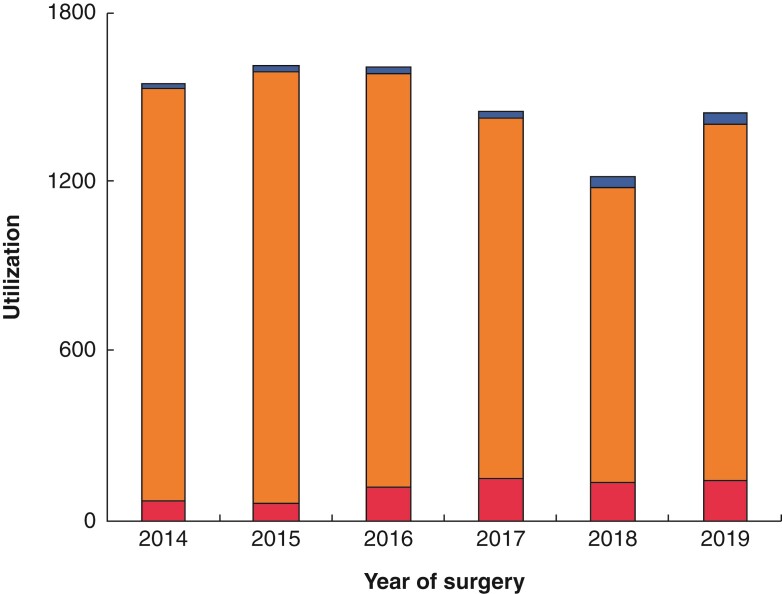
Fig. 2.
Regional anaesthesia utilization versus year of surgery The utilization of regional anaesthesia (red, lower section of bar), general anaesthesia (orange, middle section of bar), and both general and regional anaesthesia (blue, top section of bar) are displayed. The percentage of revascularization surgeries performed with regional anaesthesia only between 2014 and 2019 (per year) were 4.7 (72 of 1549), 4.1 (66 of 1613), 7.5 (121 of 1609), 10.2 (148 of 1453), 11.0 (135 of 1224), and 10.1 (146 of 1445) respectively (P < 0.0001, Cochran–Armitage trend test, two-sided)

