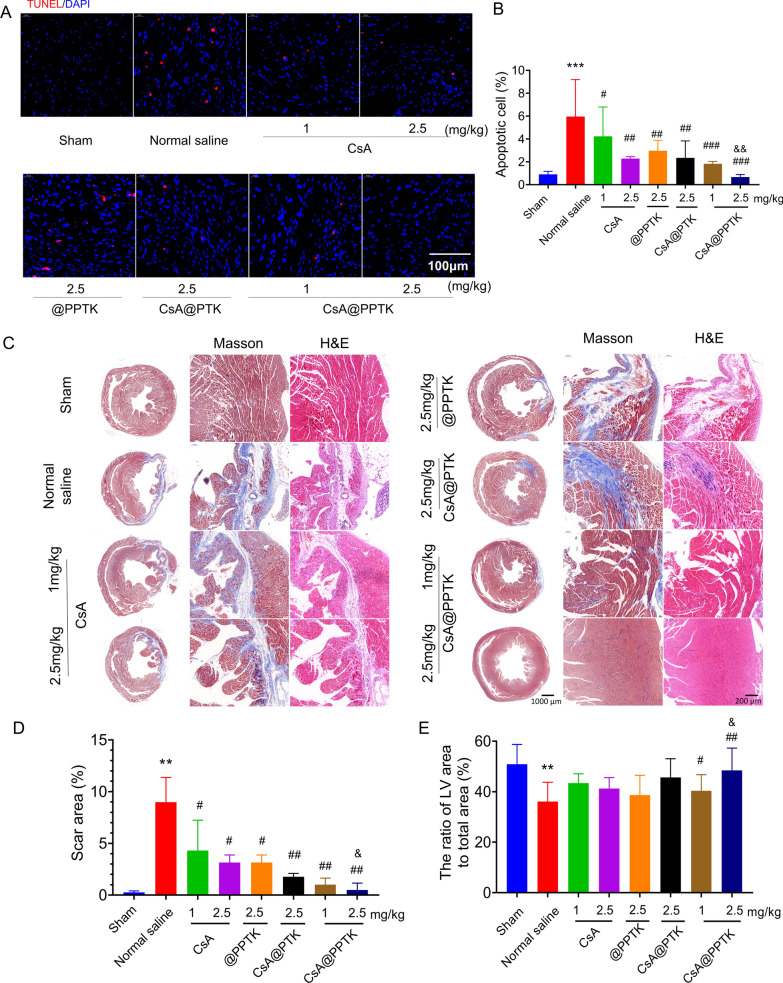
Fig. 7.
The protective effect of CsA@PPTK on MI/RI mice. A Representative images of TUNEL staining in myocardial tissue of MI/RI mice at 7 days after reperfusion. B The percentage of apoptotic cells. C Representative image of Masson and H&E staining of myocardial tissue of MI/RI mice at 28 days after reperfusion. D Statistical results of the scar area. E Statistical results of the LV area. n = 5, mean ± SD; **p < 0.01, ***p < 0.001 compared with sham group; #p < 0.05, ##p < 0.01, ###p < 0.001 compared with normal saline group; &p < 0.05, &&p < 0.01, compared with the same concentration of CsA group

