
Fig. 2.
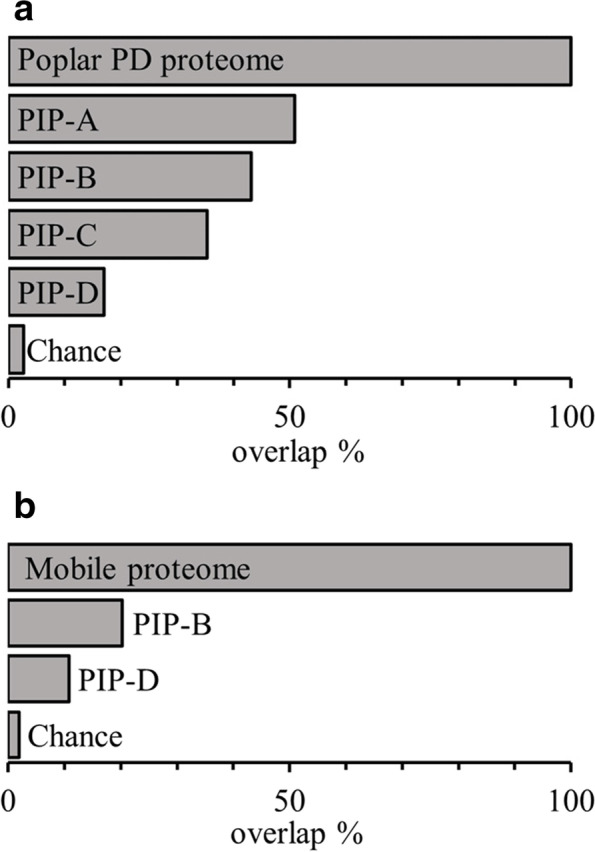
Overlaps between PIP1 outputs and experimental proteomes. In silico proteome PIP1-A-D for poplar and Arabidopsis thaliana were generated using the pipeline described in Fig. 1 (see Additional file 1: Table S4 and Table S5). a Overlap (in %) between the in silico and the experimental poplar proteome determined in [4]. See also Additional file 2: Fig. S2. b Overlap (in %) between PIP1-B and PIP1-D lists and the mobile proteome reported for A. thaliana in [51]. In both cases, the size of the overlap by chance was determined by bootstrap sampling of the whole genome (10,000 cycles, median % overlap given)