Fig. 6.
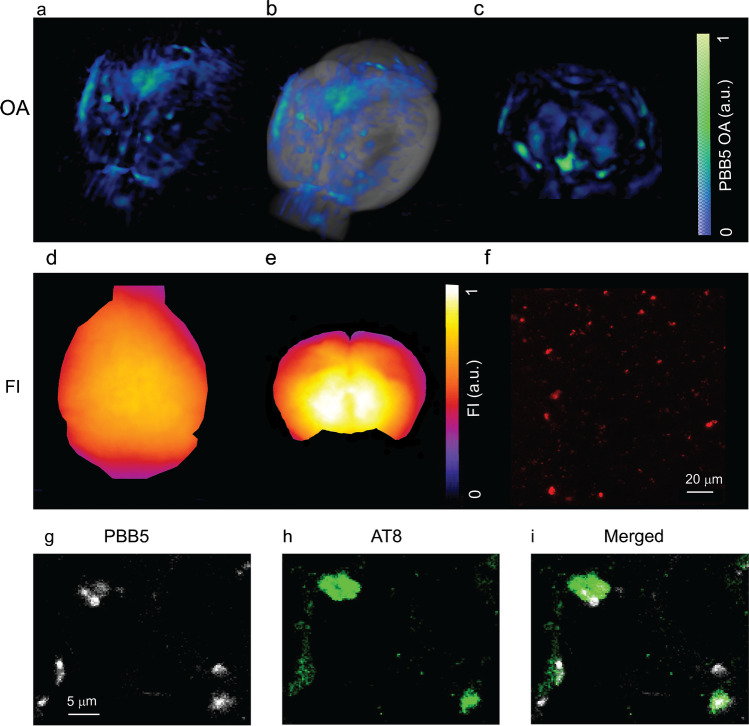
Ex vivo validation using vMSOT, epi-fluorescence imaging, multiphoton microscopy, and immunofluorescence staining. (a–c) Ex vivo vMSOT of whole brain and brain slices at 90 min after PBB5 i.v. injection; (a) 3D rendering of ex vivo vMSOT data unmixed for PBB5 distribution in P301L mouse brain; (b) overlay of a on MRI structural data; (c) ex vivo vMSOT of 1 mm mouse brain slice data unmixed for PBB5 distribution in P301L mouse brain. The PBB5 absorbance signal strength is indicated by a blue-green color map; (d, e) epi-fluorescence of a and c; (f) multiphoton microscopy (MPM) regional quantification multiphoton. Scale bar = 20 μm; (g–i) confocal microscopic images of hippocampal sections from P301L mice. PBB5 (white) and Alexa488-AT-8 (green) in the hippocampal areas. Scale bar = 5 μm

