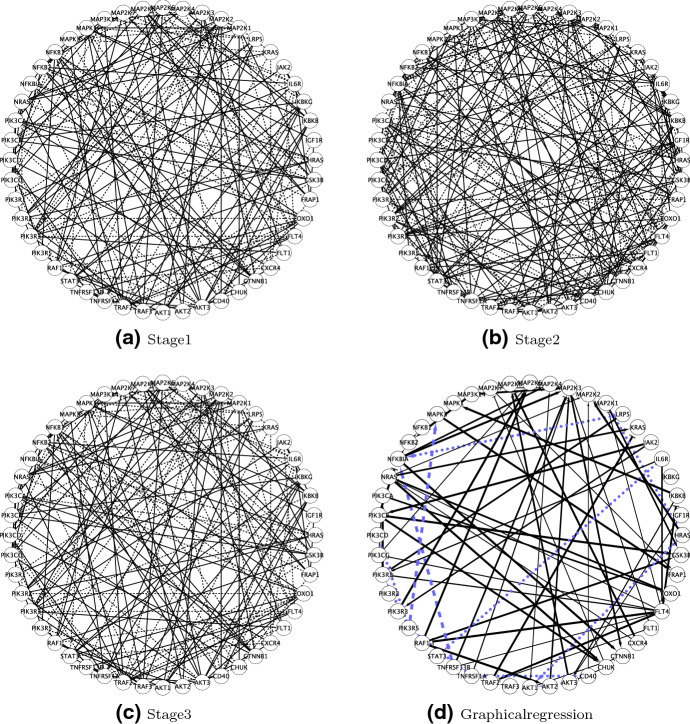
Fig. 2.
Multiple myeloma network analyses. Panels (a)-(c). The estimated stage-specific gene co-expression networks. The solid lines indicate positive partial correlations and the dashed lines indicate negative partial correlations. Panel (d). The estimated gene regulatory network from graphical regression integrating the prognostic factors: SM and serum albumin. The solid lines with arrowheads indicate positive constant effects; solid lines with flat heads indicate negative constant effects; dashed lines indicate linearly varying effects; dotted lines indicate nonlinearly varying effects; the width of the solid line is proportional to the posterior probability of inclusion

