
Figure 1.
RGCs are lost continuously over a 28-day period after RIR injury.
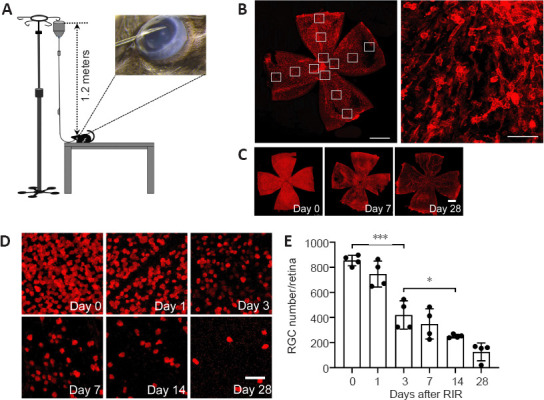
(A) Schematic diagram of the strategy used to induce RIR injury. A 30-gauge needle connected to 1.2-meter tall saline container was cannulated in the anterior chamber of the mouse eye. (B) Illustration of the strategy used for counting cells in retinal flat mounts. The image on the left shows a whole retinal flat mount photographed at 100× magnification (red: IBA1 [ionized calcium binding adaptor molecule 1], scale bar: 1 mm), and the image on the right shows a part of the flat mount photographed at 200× magnification (scale bar: 50 μm) for cell counting. Each retina was divided into four quadrants with 3 different regions each (highlighted by 12 small white boxes in the retina), i.e., the central, intermediate, and peripheral regions, and the images were captured for cell counting as shown in the right panel. The average cell numbers in these 12 regions were used to calculate the cell density for the entire retina. Changes in RGC numbers on days 0, 1, 3, 7, 14, and 28 after RIR injury are shown in (C) and (D). RNA binding protein, mRNA processing factor (RBPMS; (red) was used as a marker for RGCs. (C) Representative images for the assessment of RBPMS expression within the whole retina (scale bar: 50 µm) showed that RGC loss occurred in a homogeneous fashion over the entire retina, including the region close to the optic nerve head and in the periphery, and the loss became gradually more severe over time. (D) Representative images for RBPMS+ cell counting (scale bar: 1 mm). The RBPMS+ cell numbers decreased and the RBPMS– regions expanded gradually until almost the entire retina was RBPMS– by day 28 after RIR surgery. (E) The quantification of RBPMS+ cells in panel D, which represents the average RGC number in retinas from mice at 0, 1, 3, 7, 14, and 28 days after RIR. The bar chart indicated that RGCs were lost continuously within the 28-day period following RIR. Among adjacent time points, the largest RGC reduction occurred between days 1 and 3. On days 7 and 28, the number of RGCs decreased to approximately 50% and 25% of that observed on day 0, respectively. n = 4 mice per group. Data are expressed as the means ± SD; *P < 0.05, ***P < 0.001 (unpaired Student’s t-tests). Three independent replicates were measured in each experiment. RGC: Retinal ganglion cell; RIR: retinal ischemia/reperfusion.