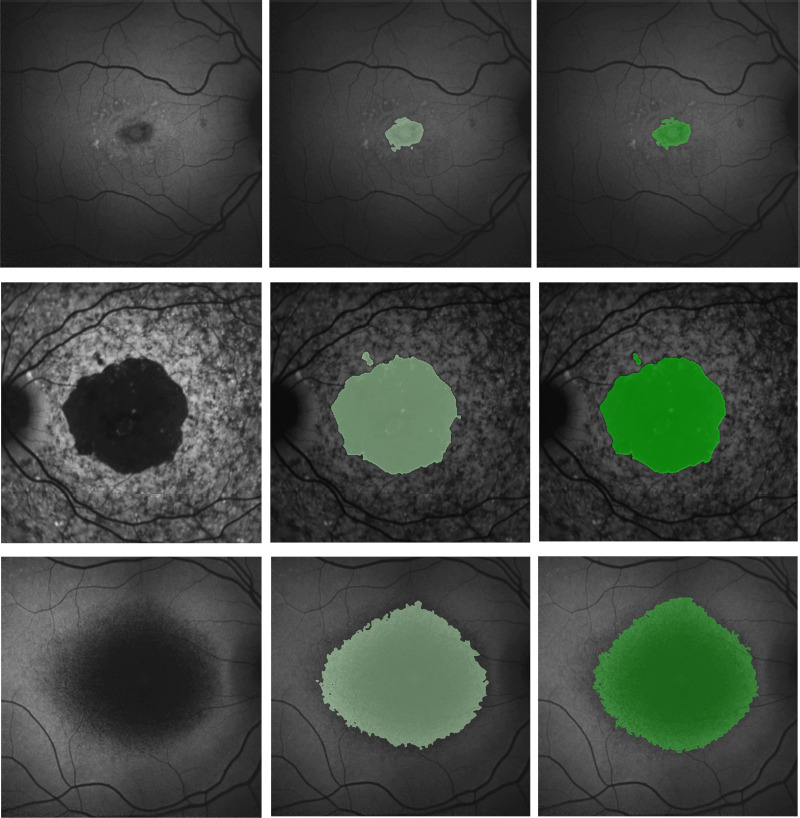
Figure 4.

Example illustration of the results of the Stargardt atrophic lesion segmentation on fundus autofluorescence images.
Left column: Fundus autofluorescence images. Middle column: U-Net segmentation results (light green) overlapping on fundus autofluorescence. Right column: manual delineation results (darker green) overlapping on fundus autofluorescence. Reprinted with permission from Wang et al. (2019).
