Figure 2.

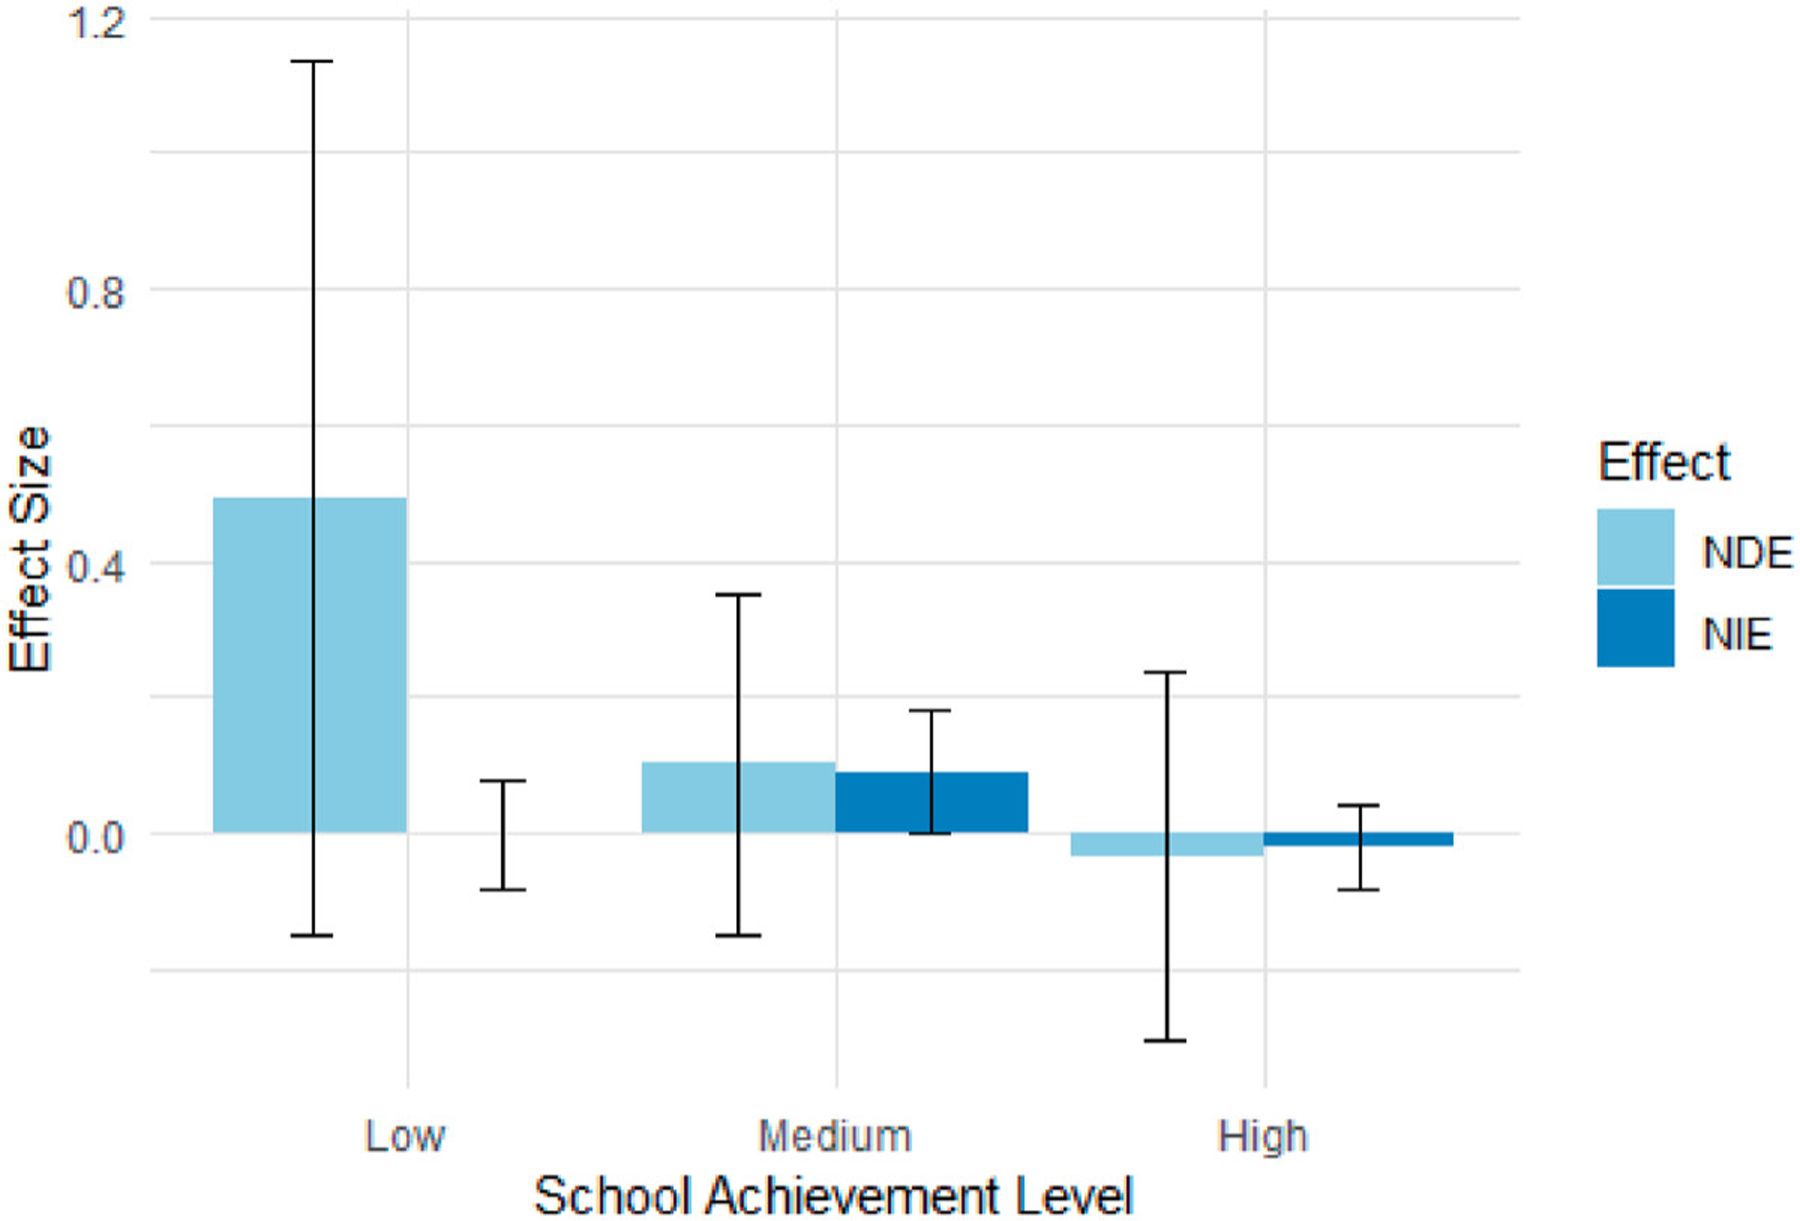
Bar chart showing the natural direct and indirect effect estimates at low-achieving, medium-achieving, and high-achieving schools. Each pair of error bars represents the 95% confidence interval of the corresponding effect estimate.

Bar chart showing the natural direct and indirect effect estimates at low-achieving, medium-achieving, and high-achieving schools. Each pair of error bars represents the 95% confidence interval of the corresponding effect estimate.