
Figure 8.
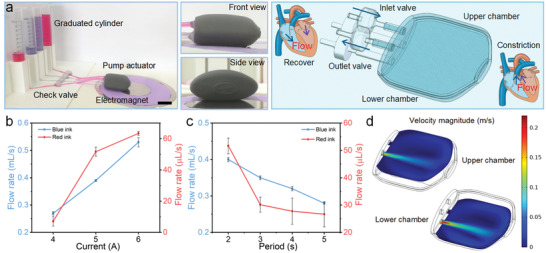
Demonstration experiment for the pump actuator. a) The digital image and schematic diagram of the pump actuator (scale bar: 2 cm). b) Plot of flow rate versus current. c) Plot of flow rate versus period. d) The simulated results for the fluid velocity of the cross section. b,c) All the data were obtained by three independent experiments (n = 3) and the mean ± standard deviations were presented.