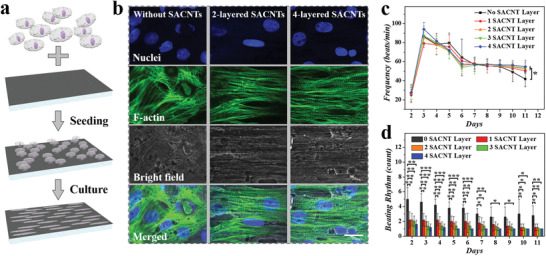
Figure 4.

a) Schematic illustration of the culture and alignment of cardiomyocytes on the electroconductive structural color hydrogel. b) Fluorescent images (nuclei in blue and F‐actin in green) showing the morphology of cardiomyocytes cultured on substrates with/without SACNTs. c) Cellular frequency statistics on substrates integrated with different layers of SACNTs. d) Statistic diagram showing the pacemaker numbers on different substrates. Scale bar is 25 µm. Error bars represent standard deviation (SDs) and sample size (n) was 3. *p < 0.05, **p < 0.01, ***p < 0.001 when compared with the group with no SACNT layer.
