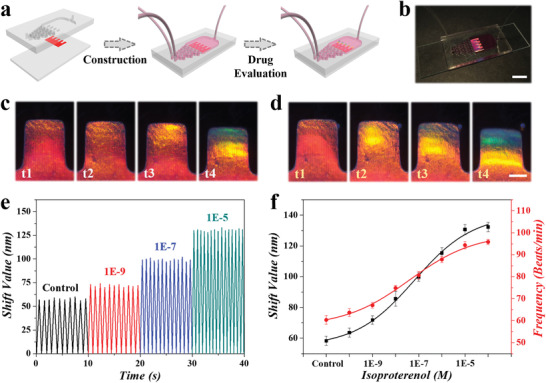
Figure 5.

a) Schematic diagram of the fabrication and assembly of heart‐on‐a‐chip for drug evaluation. b) Optical photograph showing the derived heart‐on‐a‐chip. Scale bar is 1 cm. c,d) Microscopy photographs showing the structural color variation in the functional hydrogel c) without or d) with isoproterenol stimulation. Scale bar is 0.5 mm. e) Statistic graph showing the relationship between shift values and beating velocity under different isoproterenol concentrations. f) Relationship revealing the shift values of wavelength and beating frequency change under different concentrations of isoproterenol. Error bars represent SDs (n = 5).
