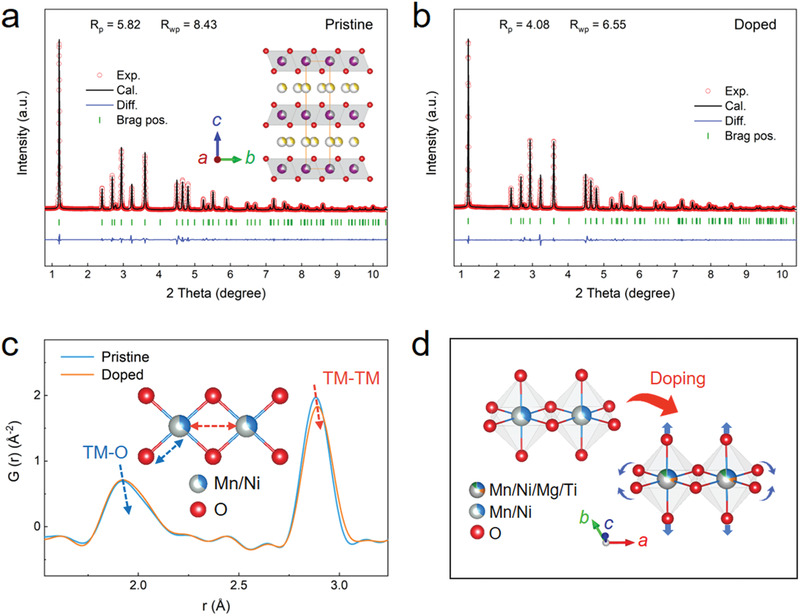
Figure 2.

a) Rietveld refinements of the XRD patterns for P‐NNM and b) D‐NNM samples. The inset in a) provides the schematic diagram of the P63/mmc unit cell used for the refinements. c) The comparison of low‐r PDF patterns between P‐NNM and D‐NNM samples. The inset shows the octahedral bonding environment in the P2 structure. d) The schematic diagram of the local octahedral distortion upon doping extracted from the PDF refinements.
