Figure 3.

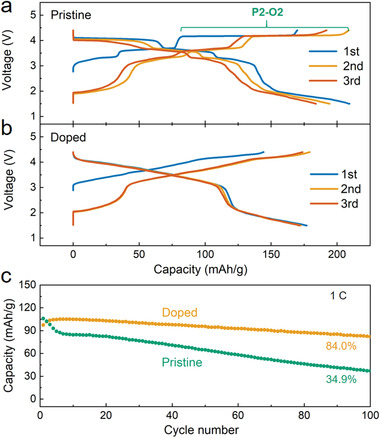
a) The charge–discharge voltage profiles of the P‐NNM and b) the D‐NNM materials for the first three cycles at 0.1 C. c) The comparison of capacity retentions at 1.0 C for 100 cycles.

a) The charge–discharge voltage profiles of the P‐NNM and b) the D‐NNM materials for the first three cycles at 0.1 C. c) The comparison of capacity retentions at 1.0 C for 100 cycles.