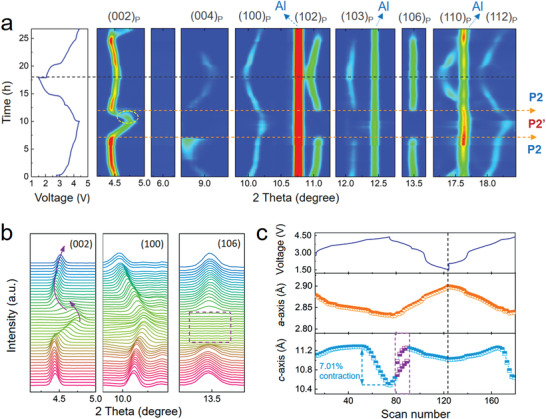
Figure 5.

a) Contour plots of the in situ XRD patterns collected from the D‐NNM cell along with the voltage profile. The yellow dashed arrows separate the P2 and P2’ phase regions. b) The typical peak profiles of the in situ XRD patterns. The purple arrows depict the peak evolutions with broken continuity, and the purple dashed square shows the sudden weakening of the peak intensities. c) The lattice evolutions of a‐axis (upper) and c‐axis (lower) as well as the corresponding voltage profile. The purple dashed lines emphasize the region of structural break associated with the peak splitting.
