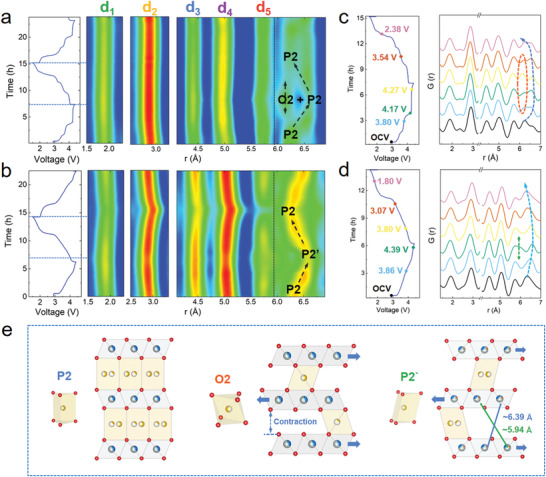
Figure 6.

a) G(r) contour plots of P‐NNM and b) D‐NNM along with their corresponding voltage profiles. The black arrows show the evolutions of the high‐voltage interlayer distances. c) Stacked profiles of the in situ PDF patterns for P‐NNM and d) D‐NNM at selected voltages. The blue dashed arrows indicate the evolution of interlayer distances at high voltage. The red dashed region in c) shows the appearance of the O2 features in P‐NNM, while the green dashed arrow in d) indicates a newly emerged P2’ feature in D‐NNM at high voltage. e) The schematic diagrams of local structures for P2, O2, and P2’ phases with their Na—O coordinating.
