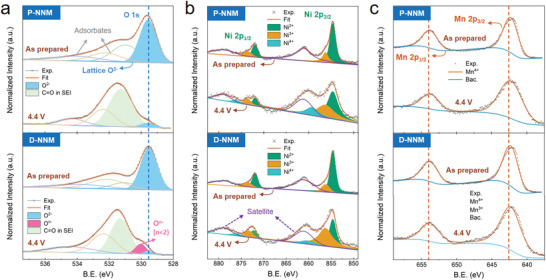
Figure 7.

a) The NAP‐XPS peak evolution of a) O 1s, b) Ni 2p, and c) Mn 2p states for the P‐NNM (upper) and D‐NNM (lower) samples. The blue dashed line in a) shows the peak position of lattice O2−, while the orange dashed lines in c) indicate the consistent peak positions of Mn4+ doublets.
