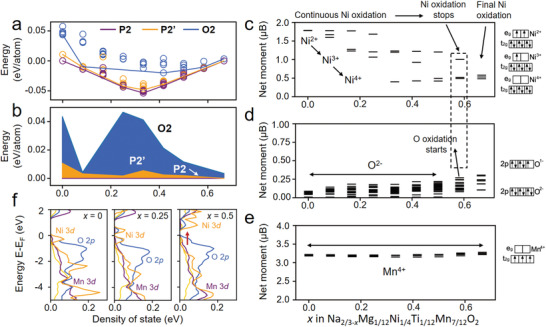
Figure 8.

a) Thermodynamic convex hull of the P2, P2’, and O2 phases during the desodiation process. b) Relative energy evolution of the P2’ and O2 phases versus the pristine P2 phase. c) PDOS of the O 2p orbitals and Ni/Mn/Ti 3d orbitals as a function of Na composition at (left) x = 0.00, (middle) x = 0.25, and (right) x = 0.50 in the D‐NNM.
