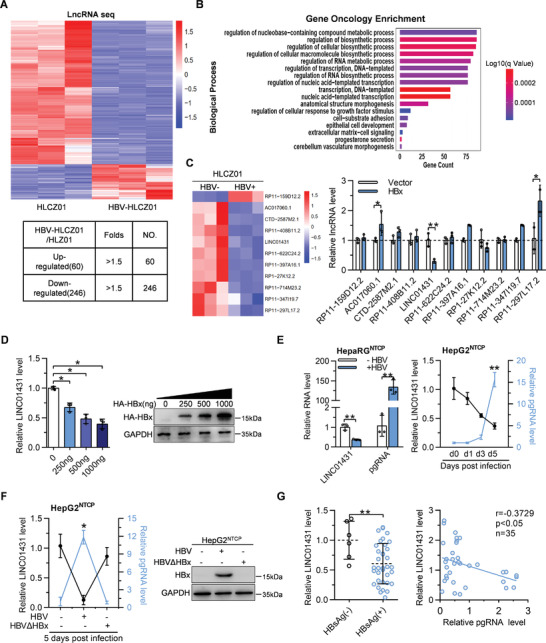
Figure 1.

HBV infection especially HBx downregulates LINC01431 expression. A–C) LncRNA sequencing was performed in HLCZ01 cells with or without HBV infection. A) The heat map of lncRNA sequencing was shown in the upper panel and the number of differentially expressed lncRNAs was shown in the bottom panel. Upregulated and downregulated lncRNAs were colored in red and blue, respectively. B) Gene Ontology analysis focused on biological processes after HBV infection, summarized based on the enrichment score. C) The heat map of 11 novel lncRNAs related to transcriptional regulation and RNA synthesis was shown in the left panel, and the expression levels of these lncRNAs in HBx‐transfected Huh7 cells detected using RT‐qPCR was shown in the right panel. D) RT‐qPCR and immunoblot analysis of LINC01431 RNA and HBx expression in HBx‐transfected Huh7 cells. E) RT‐qPCR analysis of LINC01431 and pgRNA in HBV‐infected HepaRGNTCP (left) and HepG2NTCP cells (right). F) Expression of LINC01431, pgRNA and HBx in HBV and mutant HBVΔHBx‐infected HepG2NTCP cells. The total RNA and protein were extracted at 5 days post infection (dpi), followed by RT‐qPCR and immunoblotting, respectively. G) Correlation analysis of LINC01431 with HBsAg (left) and pgRNA (right) in human HCC para‐tumor tissues. The samples were divided into HBsAg negative and HBsAg positive groups according to the presence of HBsAg, and the levels of LINC01431 RNA were quantified by RT‐qPCR (left, HBsAg(−) n = 6, HBsAg(+) n = 35). For (C–F), representative of 3 independent experiments. Data information: data were presented as mean ± SD and normalized to the control group. Pearson's correlation coefficient (E–G). Two‐tail unpaired Student's t‐tests; * p < 0.05; ** p < 0.01 (C–G).
