Figure 2.

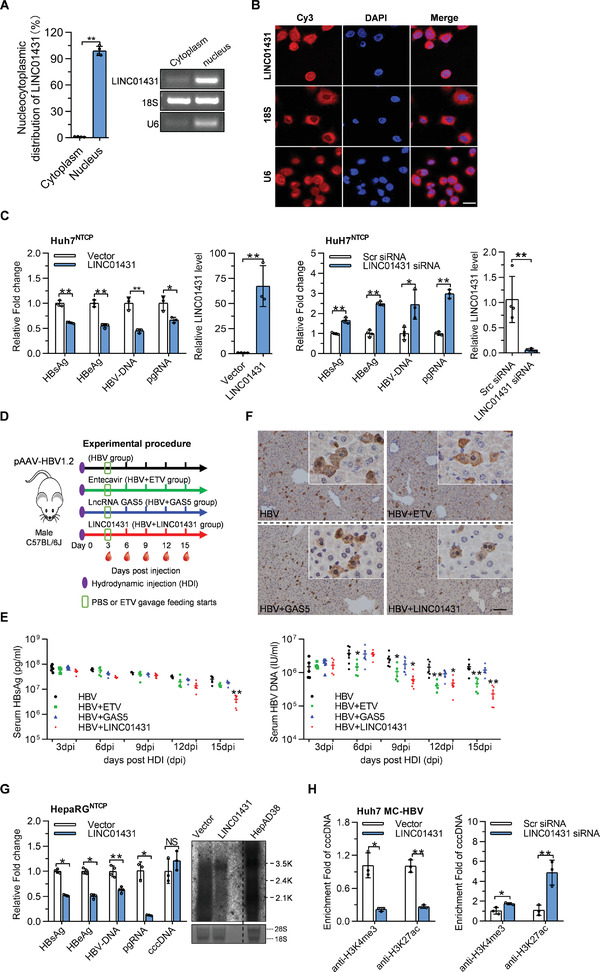
LINC01431 is localized in the nucleus and represses HBV cccDNA transcription. A) RT‐qPCR analysis of LINC01431 RNA in the cytoplasmic and nuclear fraction of HepG2 cells. B) RNA FISH assays were performed in Huh7 cells. Nuclei were stained with DAPI. Scale bar, 20 µm. C) LINC01431 overexpression and knockdown were performed in HBV‐infected Huh7NTCP cells. The levels of HBV antigens, HBV‐DNA, and pgRNA were detected at 5 dpi. D,F) HBV carrier mice were prepared by hydrodynamic injection (HDI) of pAAV‐HBV1.2 and then were randomly divided into four groups as indicated. Blood was collected every 3 days, and mice were sacrificed at 15 dpi. The levels of HBsAg, HBV‐DNA, and HBcAg were measured by ELISA, IHC, and RT‐qPCR, respectively. Animal study design (D). HBsAg and HBV‐DNA in serum (E), and hepatic HBcAg (F) were measured (n = 5).Scale bar, 50 µm. G) LINC01431 overexpression was performed in HBV‐infected HepaRGNTCP cells, and the levels of HBV antigens, HBV‐DNA, cccDNA, and HBV RNAs were detected at 7 dpi. H) ChIP assay was performed in MC‐HBV‐transfected Huh7 cells with the presence of LINC01431 (left) or LINC01431 siRNA (right). The enrichment of H3K4me3 and H3K27ac on cccDNA was determined at day 3 post transfection. Normalized data were shown as relative fold enrichment to the control group. For all experiments, representative of 3 independent experiments. Data information: data were presented as mean ± SD and normalized to the control group. Two‐tail unpaired Student's t‐tests; * p < 0.05; ** p < 0.01; NS, no significance (A,C,E,F–H).
