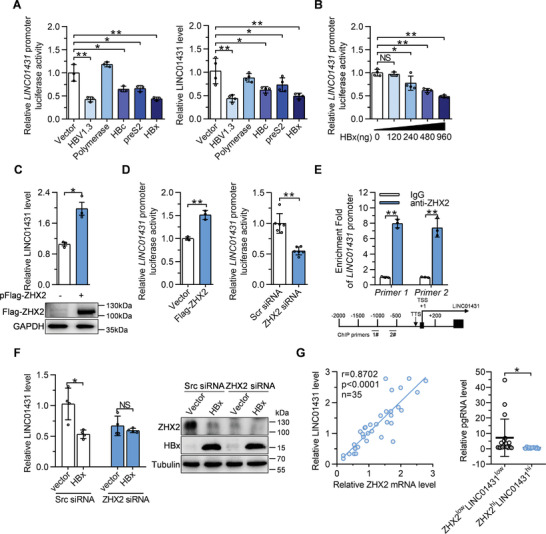
Figure 7.

HBx transcriptionally represses LINC01431 expression via manipulating transcription factor ZHX2. A) Huh7 cells were transfected with LINC01431 promoter and different HBV plasmids, the relative promoter activity was detected at day 2 post transfection using dual luciferase assay (left). Levels of LINC01431 were measured using RT‐qPCR (right). B) Luciferase reporter assay of LINC01431 promoter in HBx‐transfected Huh7 cells. C) Huh7 cells were transfected with Flag‐ZHX2, LINC01431 and ZHX2 expression were detected using RT‐qPCR and immunoblotting, respectively. D) Luciferase reporter assay of LINC01431 promoter in HepG2 cells in the presence of Flag‐ZHX2 (left) or ZHX2 siRNA (right). E) ChIP assay was performed in HepG2 cells, and the enrichment of ZHX2 on the LINC01431 promoter was determined using the anti‐ZHX2 antibody. Normalized data were shown as relative fold enrichment to the IgG group. F) Rescue assay was performed in HBx‐transfected cells after silencing ZHX2. HepG2 cells were transfected with HA‐HBx and ZHX2 siRNAs for 3 days, LINC01431 expression was measured using RT‐qPCR, ZHX2, and HBx expression were evaluated by immunoblotting. G) Correlation analysis between LINC01431 and ZHX2 RNA in HCC para‐tumor tissues (left, n = 35). Patients were stratified according to the median value of ZHX2 RNA, and the levels of pgRNA were compared between ZHX2lowLINC01431low and ZHX2hiLINC01431hi groups (right). For (A–F), representative of 3 independent experiments. Data information: data were presented as mean ± SD and normalized to the control group. Pearson's correlation coefficient (G). Two‐tail unpaired Student's t‐tests (A–F); *p < 0.05; **p < 0.01; NS, no significance (A–G).
