
Figure 3.
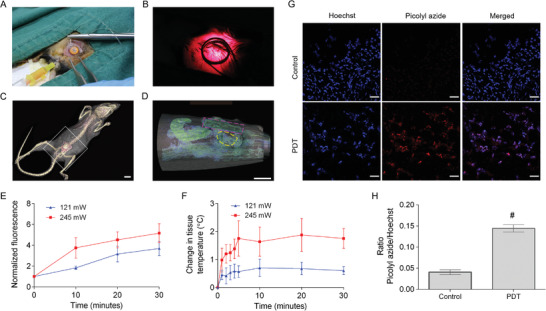
Wireless device implantation strategy. A) Photograph of the wireless device positioned on the abdominal tissue adjacent to the mouse bladder and anchored on the abdominal muscles with a few turns of the sutures. B) Photograph of the activated device after wound closure. C) CT scan of a mouse with a wireless device implanted (white dotted line) Scale bar, 10 mm. D) Magnified CT scan showing the sagittal view of the implanted device (pink dotted line) above the inflated bladder (yellow dotted line) in the lower abdominal region of the mouse (white square box in (C)) Scale bar, 5 mm. E) SOSG assay using bladder‐instilled photosensitizer/SOSG solution. F) Tissue temperature changes over time during wireless activation. The experiment was performed once (n = 2). Data were represented as mean ± SD. G) TUNEL assay to detect apoptosis in the bladders of tumor implanted mice after one PDT session at input power 121 mW. Blue (Hoechst 33 342) indicates stained DNA, and red (TUNEL, picolyl azide dye) indicates apoptotic cells. Objective lens, 20×. Scale bar, 50 µm. H) Mean grey areas of DNA and picolyl azide staine were measured using Image J software. The mean grey area data was represented as picolyl azide/Hoechst ratio. Data were represented as mean ± SD (n = 3). # p < 0.005.