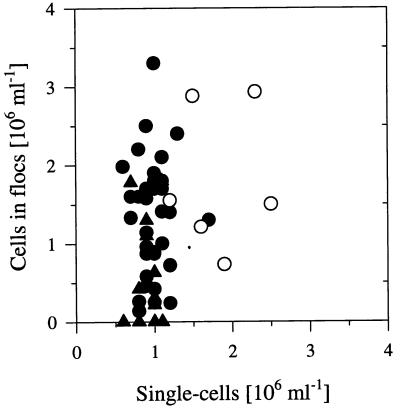
FIG. 3.
Plot of the number of single-celled bacteria against the number of cells in flocs. The data set represents only samples from the flagellate-controlled phases of reactor I (circles) as well as from reactor II (triangles). The open circles represent data from a 20-day period (about 10% of the total flagellate-controlled phases), and the solid circles represent data from the other periods.

