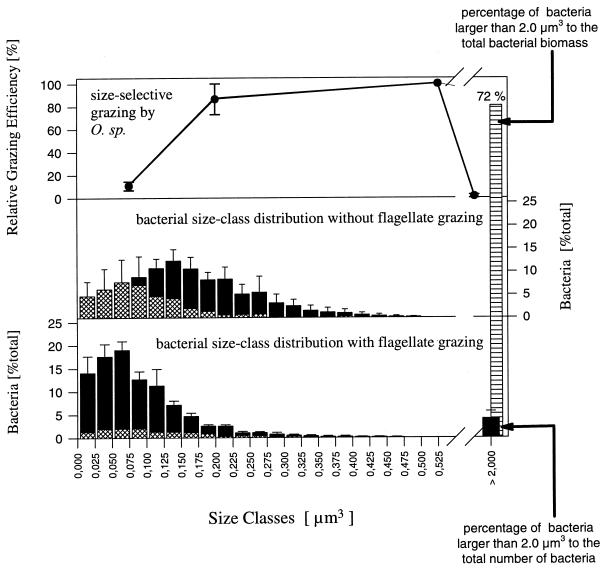
FIG. 6.
Influence of size-specific grazing of the flagellate Ochromonas sp. strain DS (upper graph) on the size distribution of the bacterial community of reactor I. The bars of the graph in the middle represent the size class distribution of the community during phase 1 (mean values of five samples). The hatched parts of the bars indicate the proportion of Vibrio sp. cells. The lower graph represents the distribution after introduction of the predator (five samples from phase 2). The size class >2.0 μm3 is exclusively formed by the Pseudomonas sp. strain MWH1 flocs (the bars represent mean values for the whole microcolony population). This size class contained 4% of the bacterial particles (single-celled bacteria and flocs) but 72% of the bacterial biomass.

