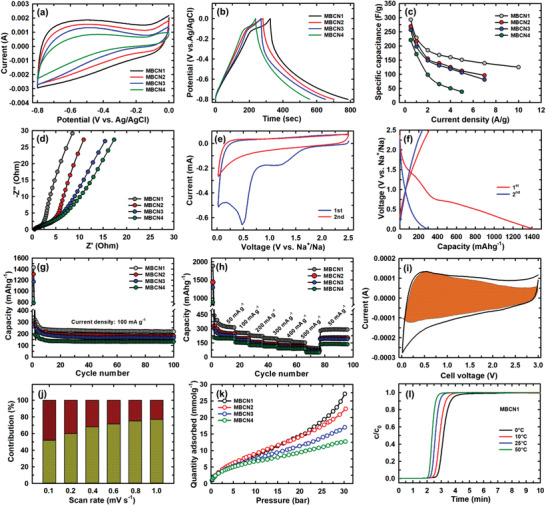
Figure 4.

a) Cyclic voltammetry curves and b) charge–discharge profile of MBCN samples measured at 0.5 A g−1. c) Specific capacitance of MBCN sample at different current densities. d) EIS spectra. e) CV profiles of MBCN1 at a scan rate of 0.2 mV s−1. f) First discharge and second charge and discharge profiles of MBCN at a current density of 100 mAh g−1. g) Cycling performances with a Coulomb efficiency of MBCN1 at a current density of 100 mA g−1. h) Rate capability. i) Contribution of (pseudo)capacitive behavior (colored region) to the overall sodium storage. j) Normalized contribution of (pseudo)capacitive and diffusion‐controlled charge storage in MBCN1, yellow and brown colors represent (pseudo)capacitive and diffusion‐controlled contribution, respectively. k) CO2 adsorption isotherm of MBCN samples measured at 0 °C and l) breakthrough curves of MBCN1 samples at 0, 10, 25, and 50 °C.
