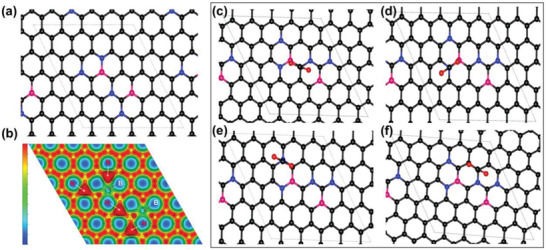
Figure 5.

a) Optimized structure (blue, pink, and black represent nitrogen, boron, and carbon). b) 2D charge density. The CO2 adsorption profile of MBCN c) Model I, d) Model II, e) Model III, and f) Model IV (black, blue, and pink represent carbon, nitrogen, and boron, red represents O of CO2).
