Figure 1.

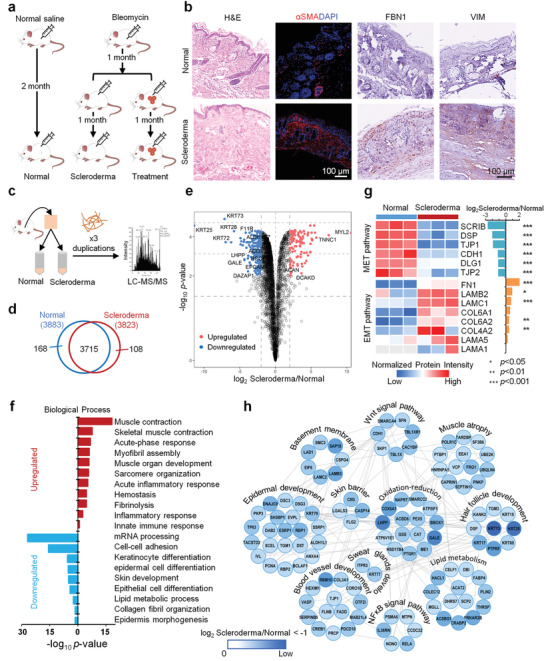
Quantitative proteome profiling of protein signatures in scleroderma mouse skin. a) Overview of study designs of LoS mouse model construction and organoid treatment. b) Hematoxylin and eosin (H&E) and immunochemical stainings of scleroderma and normal skins (scale bar: 100 µm). c) Schematics of the proteomics analysis used to evaluate scleroderma (n = 3) and normal (n = 3) mouse skin tissues. d) Overlap of the proteins identified in normal and scleroderma samples. e) Volcano plot of the −log10 p‐value versus the log2 protein abundance comparisons between scleroderma and normal mouse skin tissues. Proteins outside the significance threshold lines (−log10 p‐value > 2 and log2 Scleroderma/Normal > 1 or < −1) are shown in red (upregulated) and blue (downregulated). f) Biological process analysis of the upregulated and downregulated proteins in the skin of scleroderma mice versus normal mice. g) Heatmap represents the MET and EMT characterization of scleroderma (n = 3) and normal (n = 3) groups. Red and blue boxes indicate the normalized intensity of the enriched and depleted proteins, respectively. The histogram represents the log2 ratio of protein intensities between the scleroderma and normal groups. Asterisks indicate statistical significance, determined based on the Benjamini–Hochberg (BH)‐adjusted p‐value from pairwise comparison with a moderated t‐test (* p < 0.05; ** p < 0.01; *** p < 0.001). h) Interaction network of downregulated proteins in the skin of scleroderma mice versus normal mice. Functional clusters revealing the skin‐associated functions that are dysregulated in the scleroderma group compared to the normal group.
