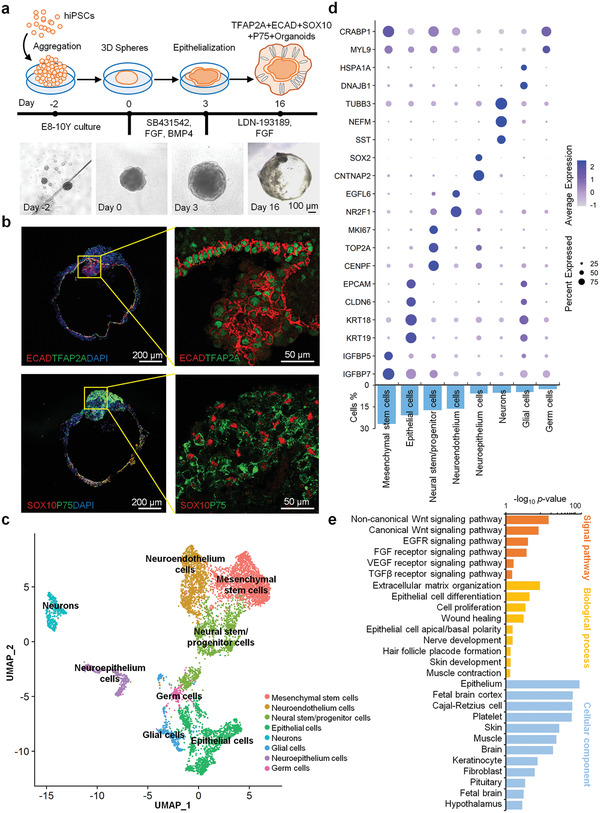
Figure 2.

Formation of skin organoids in vitro. a) Schematics of the induced pluripotent stem cell (iPSC)‐derived organoid. (scale bar: 100 µm). b) ECAD, TFAP2A, SOX10, and P75 expression analysis of iPSC‐derived organoids (scale bar: 100 and 50 µm). c) Uniform manifold approximation projection (UMAP) plots of scRNA‐seq data of day 16 EM organoids. A total of 7392 cells were represented. The major cell groups were manually annotated and labeled with different colors. d) Expressions of the key gene markers and percentage distribution of different cell clusters. The statistical significance of cell type marker genes was performed using the Wilcoxon test with BH adjusted p‐value < 0.01. e) Signal pathway, biological process, and cellular component analysis of the day 16 organoids proteomic profile.
