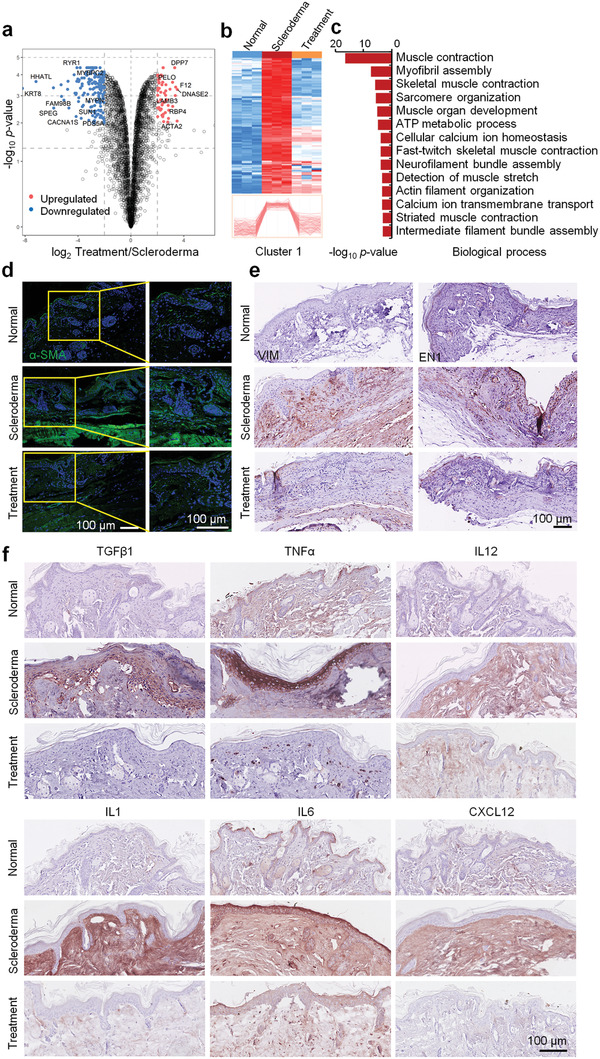
Figure 3.

EM organoids rescued skin fibrosis and inflammation in scleroderma mice. a) Volcano plot of the log10 p‐value versus the log2 protein abundance comparison between the scleroderma and organoid treatment groups. Proteins outside the significance threshold lines (−log10 p‐value > 2, log2 Treatment/Scleroderma > 1 or < −1) are shown in red (upregulated) and blue (downregulated). b) Heatmap represents the differentially expressed proteins in skin from the normal (n = 3), scleroderma (n = 3), and organoid treatment (n = 3) groups. Protein expressions in Cluster 1 were upregulated in scleroderma (compared to the normal group) and recovered by organoid treatment. c) Biological process analysis of enriched proteins in Cluster 1. d) Immunofluorescence and e,f) immunohistochemistry analysis of α‐SMA, VIM, EN1, TGFβ1, TNFα, IL12, IL1, IL6, and CXCL12 in normal, scleroderma, and organoid treatment skin tissues (scale bar: 100 µm).
