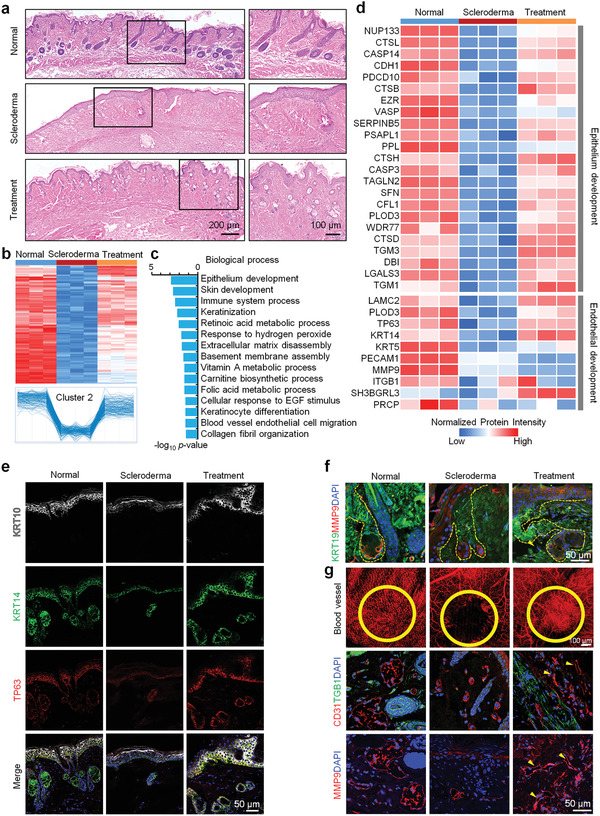
Figure 4.

EM organoids promote the regeneration of epidermis, epidermal appendages, and blood vessels in scleroderma mice. a) H&E stainings of skin tissues from the normal, scleroderma, and organoid treatment groups (scale bar: 200 and 100 µm). b) Heatmap representing the differentially expressed proteins in skin from the normal (n = 3), scleroderma (n = 3), and organoid treatment (n = 3) groups. Protein expressions in Cluster 2 were downregulated in scleroderma (compared to the normal group) and were recovered by organoid treatment. c) Biological process analysis of enriched proteins in Cluster 2. d) Heatmap represents the expression levels of proteins associated with epithelium and endothelial development in the normal (n = 3), scleroderma (n = 3), and organoid treatment (n = 3) groups. Gene names are presented on the left side of the heatmap. Red and blue boxes indicate the normalized intensity of enriched and depleted proteins, respectively. Immunofluorescence stainings of e) KRT10, KRT14, and TP63 in skin tissues and f) KRT19 and MMP9 in sweat glands from the normal, scleroderma, and organoid treatment groups (scale bar: 50 µm). g) Blood vessel analysis and CD31, TGFB1, and MMP9 expressions in skin tissues from the normal, scleroderma, and organoid treatment groups (scale bar: 50 and 100 µm).
