
Figure 4.
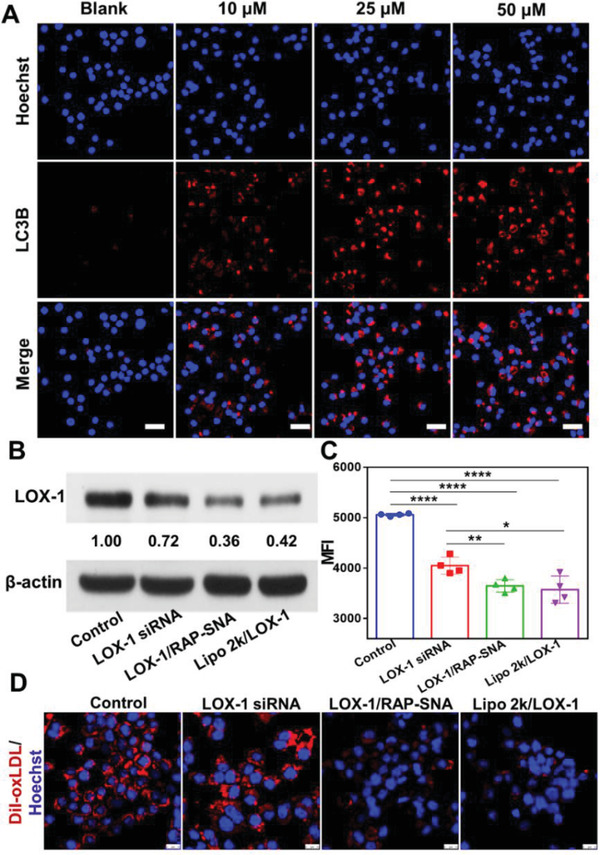
In vitro therapeutic evaluation of RAP‐SNA and LOX‐1/RAP‐SNA. A) The CLSM images of RAW264.7 cells after treatment with RAP‐SNA at different RAP concentrations (10, 25, and 50 × 10−6 m) for 24 h and stained with anti‐LC3B (autophagy marker, red signal) antibody. Scale bar: 25 µm. B) Western blot analysis of LOX‐1 expression in RAW264.7 cells after treatment with different LOX‐1 siRNA‐loading formulations. C) Flow cytometry analysis of the engulfing of DiI‐oxLDL in LOX‐1 siRNA, LOX‐1/RAP‐SNA, and Lipo 2k/LOX‐1 siRNA‐treated RAW264.7 cells. D) CLSM images of the different LOX‐1 siRNA formulations‐treated RAW264.7 cells after incubation with DiI‐oxLDL for 5 h. Scale bar: 10 µm. Statistical significance: **, P < 0.01; ***, P < 0.001; ****, P < 0.0001.