
Figure 6.
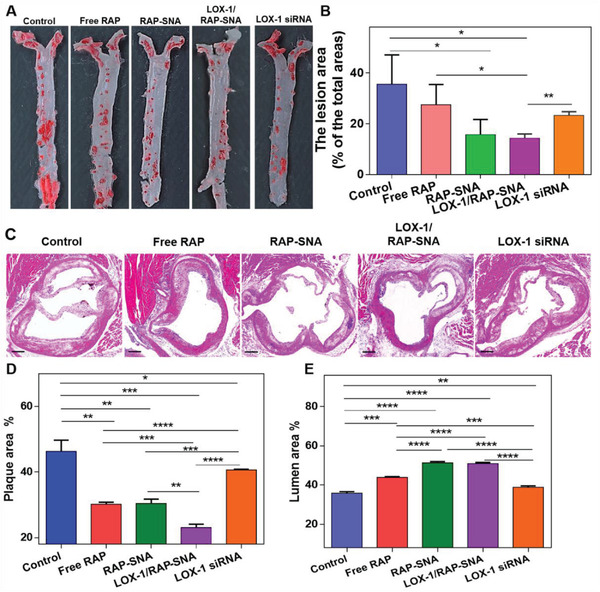
In vivo antiatherosclerosis efficiency. A) ORO‐stained images of aortas dissected from ApoE−/− mice after treatment with free RAP, RAP‐SNA, LOX‐1/RAP‐SNA, and LOX‐1 siRNA for 4 weeks. B) Quantitative analysis of the plaque lesion in the ORO‐stained images. C) H&E‐stained images of the aortas roots cross‐section obtained from ApoE−/− mice after treatment with different formulations. D,E) Statistical analysis of the plaque D) and lumen E) areas in H&E‐stained images. Statistical significance: *, P < 0.05; **, P < 0.01; ***, P < 0.001; ****, P < 0.0001. Scale bar: 200 µm.