
Figure 8.
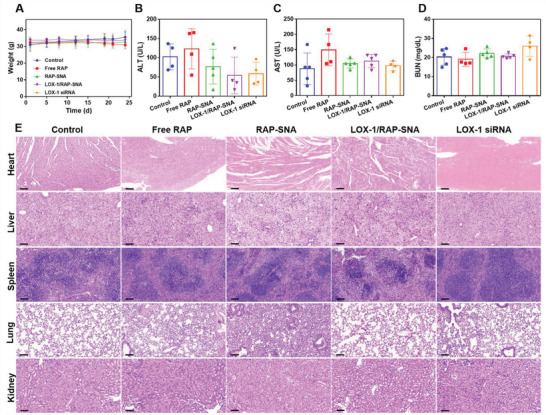
In vivo bio‐safety evaluation of different drug formulations. A) The recorded weight of ApoE−/− mice during the treatment process. B–D) The biochemical analysis of blood obtained from mice after different treatments to evaluate the liver and kidney function. ALT, alanine aminotransferase; AST, aspartate aminotransferase; BUN, blood urea nitrogen. E) H&E‐stained images of heart, liver, spleen, lung, and kidney tissues obtained from the mice after being treated with different drug formulations for 4 weeks. Scale bar: 100 µm.