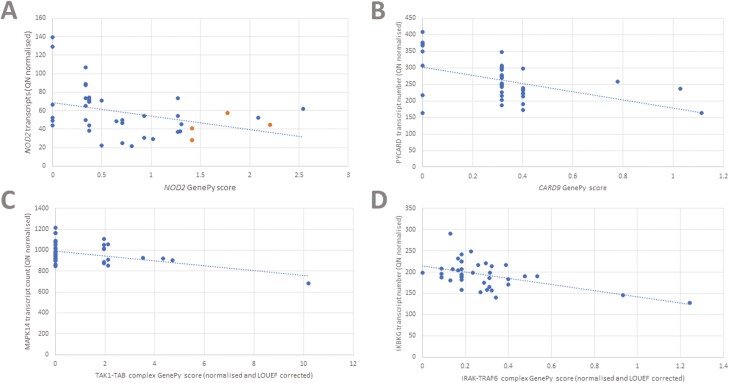
Figure 2.
A, Relationship between quantile-normalized (QN) NOD2 transcript levels and NOD2 GenePy score. Four patients harboring the 1007fs variant are seen in orange. B, Relationship between QN PYCARD transcript levels and CARD9 complex GenePy score. C, Relationship between QN MAPK14 transcript levels and TAK1-TAB complex GenePy score. D, Relationship between QN IKBKG transcript levels and IRAK-TRAF6 complex GenePy score. LOEUF, loss of function observed/expected upper bound fraction.

