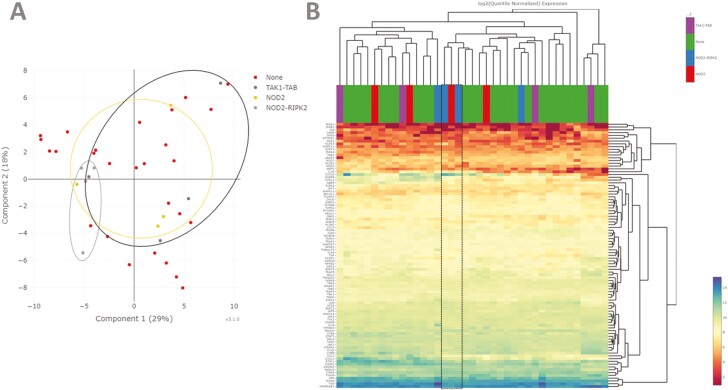
Figure 3.
A, Principal component analysis using quantile-normalized data from 95 NOD signaling genes demonstrating clustering of patients with the top 10% (4 patients) of deleterious genetic variation within NOD2-RIPK2 but with less defined grouping for NOD2 and TAK1-TAB.B, Heatmap analysis using quantile-normalized data from 95 NOD signaling genes and average linkage clustering demonstrates highly variable clustering of patients. Two patients with top 10% of deleterious genetic variation in NOD2 and 1 with top 10% in NOD2-RIPK2 do cluster (boxed area), with high transcription of CXCL8 (interleukin-8) and low expression of TFNA1.

