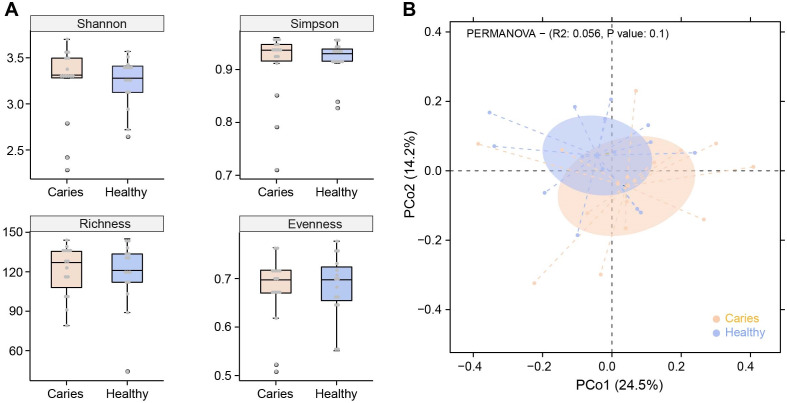
Figure 1. Comparisons of microbial diversities between S-ECC children (Caries) and healthy controls (Healthy).
Alpha diversity was evaluated by indices of Shannon, Simpson, richness and evenness (A). (B) Comparison of principal coordinates analysis (PCoA) of two groups. Each dot represents one sample.

