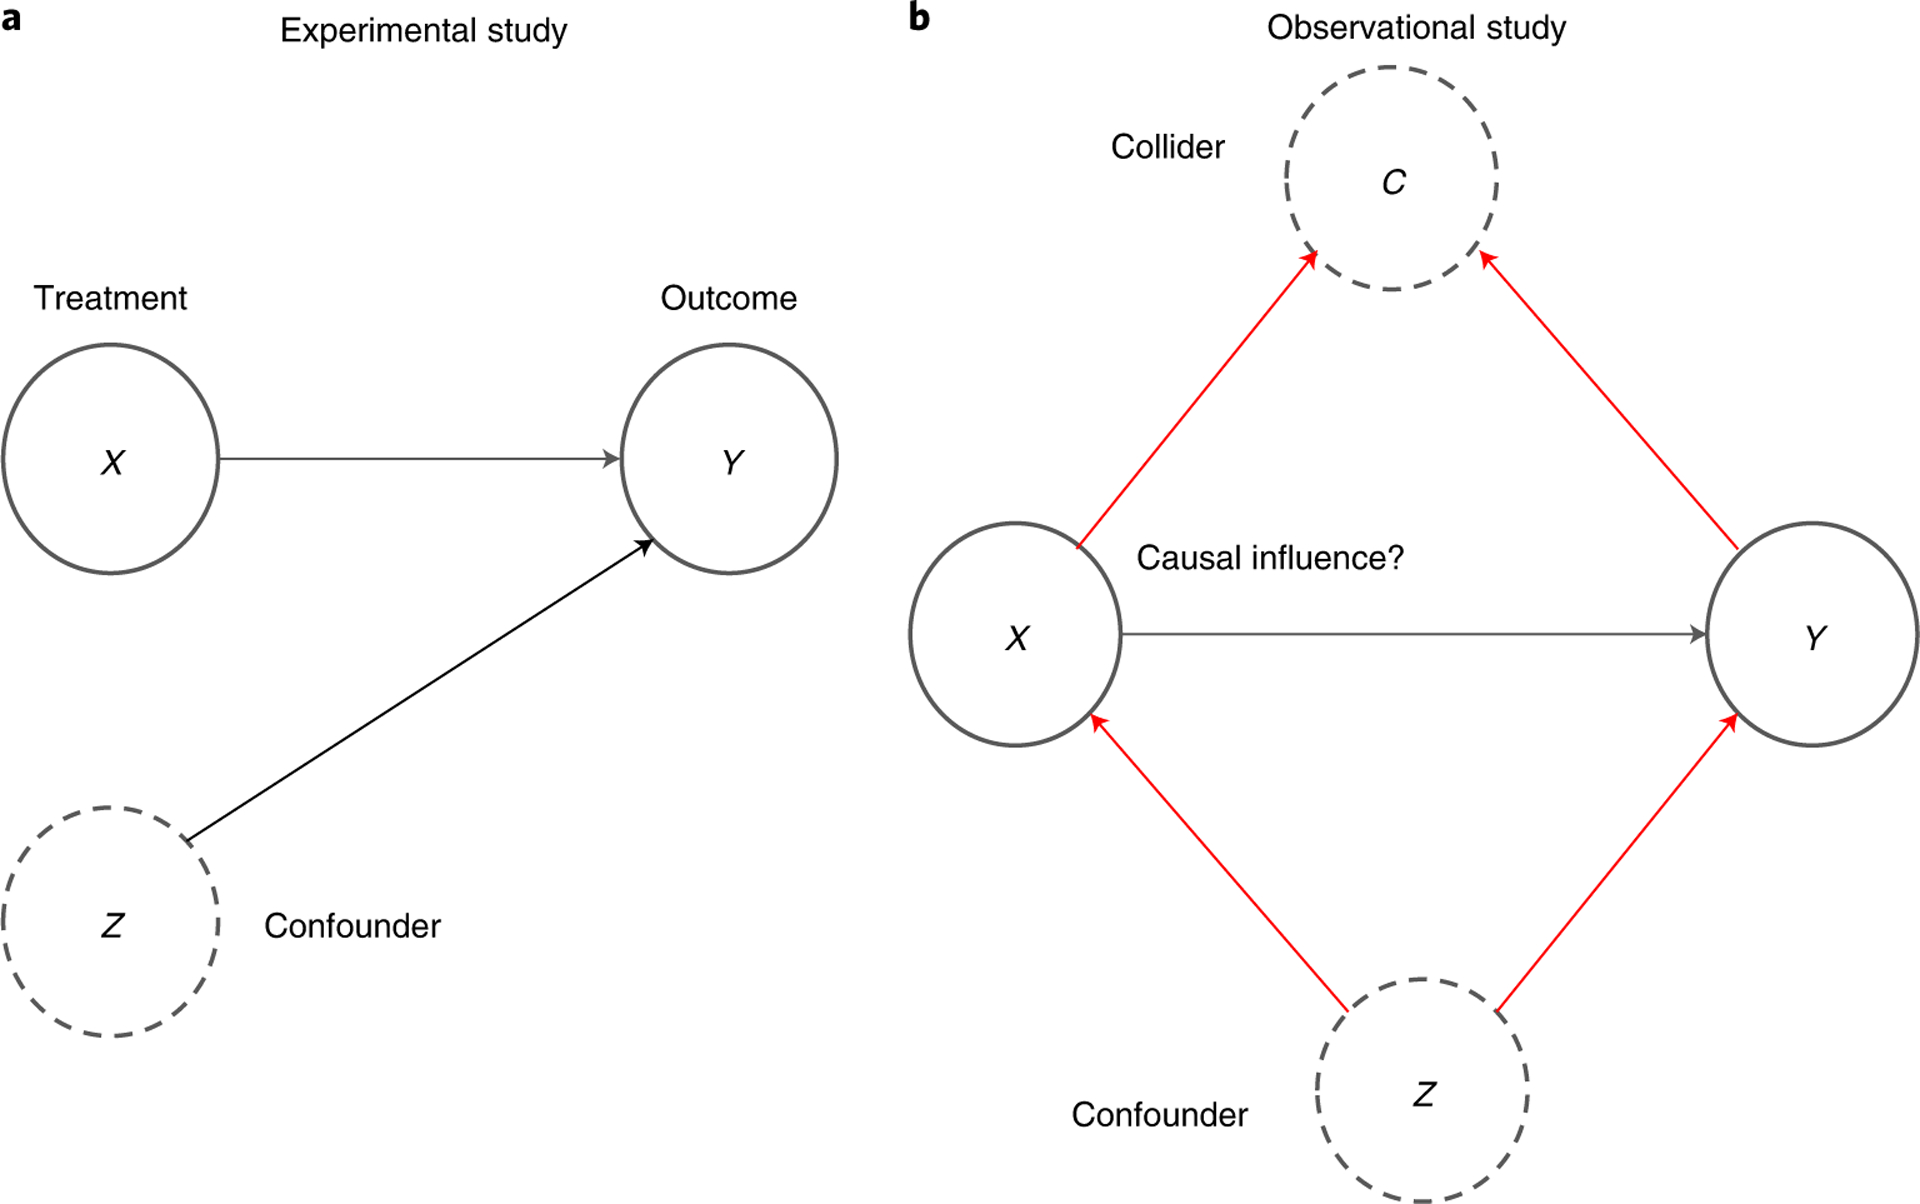
Fig. 1 |. Graphical representations for estimating causality in experimental and observational data.

a, Graphical representation of an experimental study, where there is no link between treatment X and confounder Z as X is randomized. b, Graphical representation of an observational study, where both colliders C and confounders Z can bias causal effect estimates.
