
Figure 2.
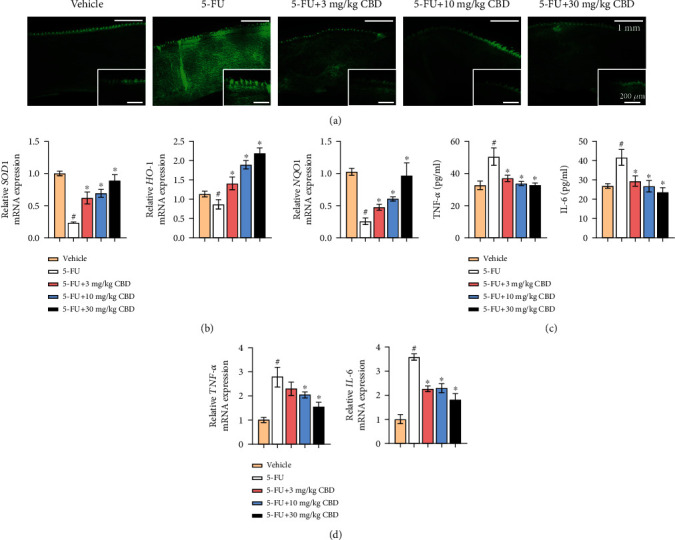
CBD defends against oxidative stress and inflammatory response in a mouse OM model. (a) Representative images of DCFH-DA staining for ROS detection. Upper scale bar, 1 mm. Lower scale bar, 200 μm. (b) mRNA expression levels of SOD1, HO-1, and NQO1 in mouse tongue tissues as measured by qRT-PCR. (c) Serum TNF-α and IL-6 levels were detected by ELISA. (d) mRNA expression levels of TNF-α and IL-6 in mouse tongue tissues were detected by qRT-PCR. β-Actin was used as the internal control. Data are expressed as the means ± SD. #P < 0.05vs. vehicle; ∗P < 0.05vs. 5-FU alone group.