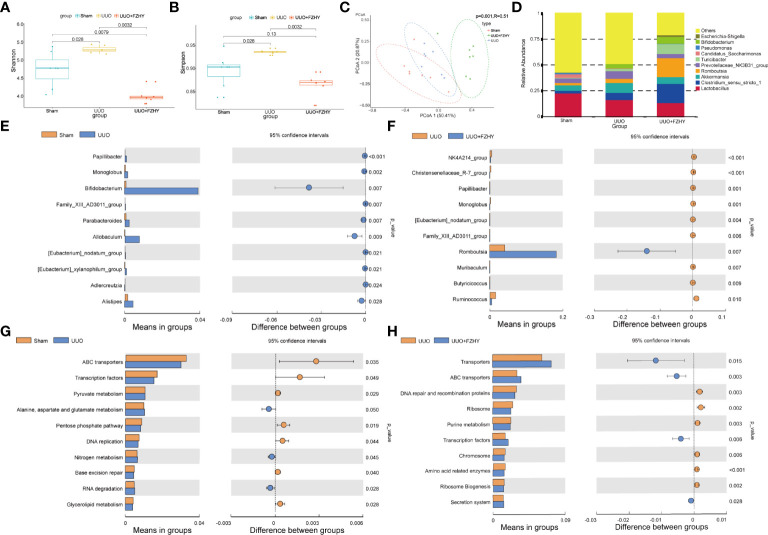
Figure 3.
Diversity and abundance analysis. The alpha diversity [Shannon (A), Simpson (B)] based on operational taxonomic unit (OTU) abundance for the sham, UUO, and UUO+FZHY groups. (C) The beta diversity shows the PCoA plot of UniFrac distances. (D) The top 10 high relative abundance for the sham, UUO, and UUO+FZHY groups. The difference of abundance at the genus level in the sham group compared with the UUO group (E) and the UUO group compared with the UUO+FZHY group (F). The difference of abundance at the genus level in the sham group compared with the UUO group (G) and the UUO group compared with the UUO+FZHY group (H). Wilcoxon rank-sum test was used to compare the difference in diversity between the two groups in the boxplot. t-test was used to compare the difference in abundance between the two groups; P <0.05 is considered to be a significant difference.

