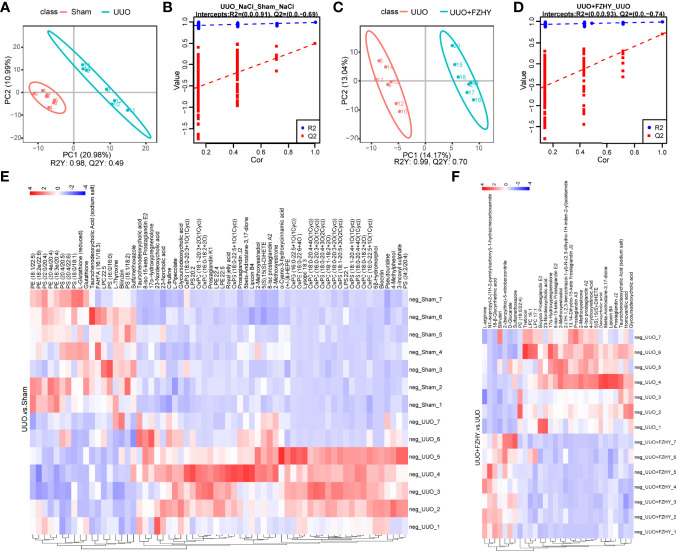
Figure 4.
Metabolomics analysis of cationic metabolites. PLS-DA score plots for the comparison of the global metabolite profiles in the UUO and sham groups (A) and the UUO+FZHY and UUO groups (C). Validation plot by permutation test for the UUO and sham groups (B) and the UUO+FZHY and UUO groups (D); the abscissa represents the correlation between the Y of the random grouping and the original group Y, and the ordinate represents the scores of R2 and Q2. R2Y represents the interpretation rate of the model, Q2Y is used to evaluate the predictive ability of the PLS-DA model, and a higher R2Y value in a PLS-DA model indicates a better model fit. The heatmap plot for metabolites between the UUO vs. sham groups (E) and the UUO+FZHY vs. UUO groups (F).

