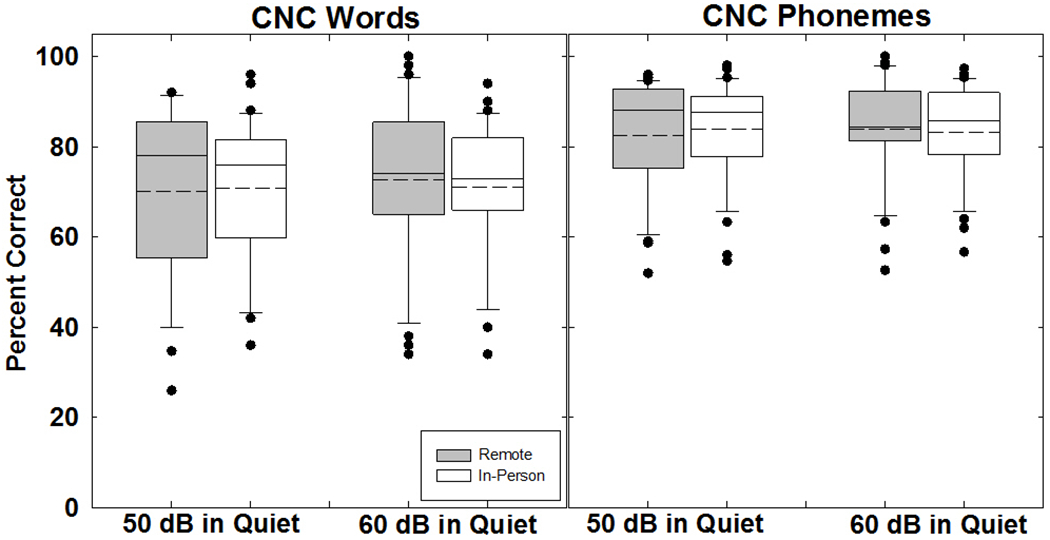
Figure 2.

Box-and-whisker plots showing percent correct for consonant-nucleus-consonant (CNC) words (left panel) and phonemes (right panel) obtained in the remote (gray boxes) and in-person (white boxes) conditions. Box boundaries represent the 25th and 75th percentiles and whiskers represent the 10th and 90th percentiles. Means and medians are shown with dashed and solid lines, respectively. Solid circles indicate outliers.
