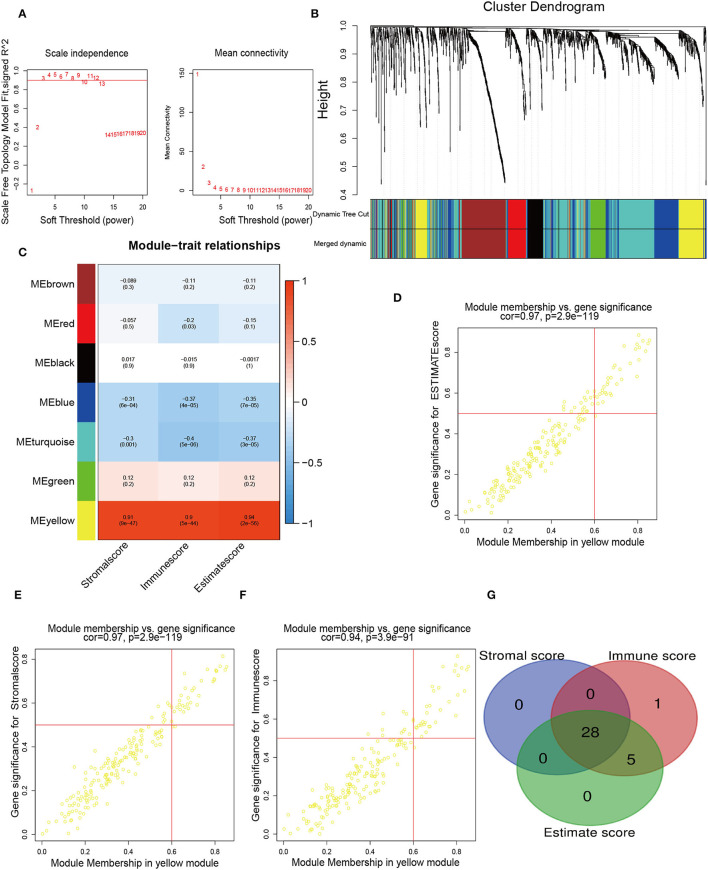
Figure 2.
Identification of immune-related hub genes. (A) WGCNA process of immune-related differentially expressed genes with a soft threshold β = 8. (B) Hierarchical clustering dendrogram of the co-expressed genes identified in the modules. Cluster dendrograms have branches corresponding to different gene modules. A clustered dendrogram has one gene corresponding to each leaf. (C) Relevance of gene modules to clinical traits. For each cell, the correlation coefficient corresponds to the relevance between the gene module and the clinical trait, which changes from red to blue. The homologous p-values are also annotated. (D–F) The eigengenes in the yellow module are shown in separate alternate scatter plots. (G) A Venn diagram shows the overlapping genes among genes grouped according to Stromalscore, genes grouped based on immunescore, and genes grouped according to Estimatescore.

