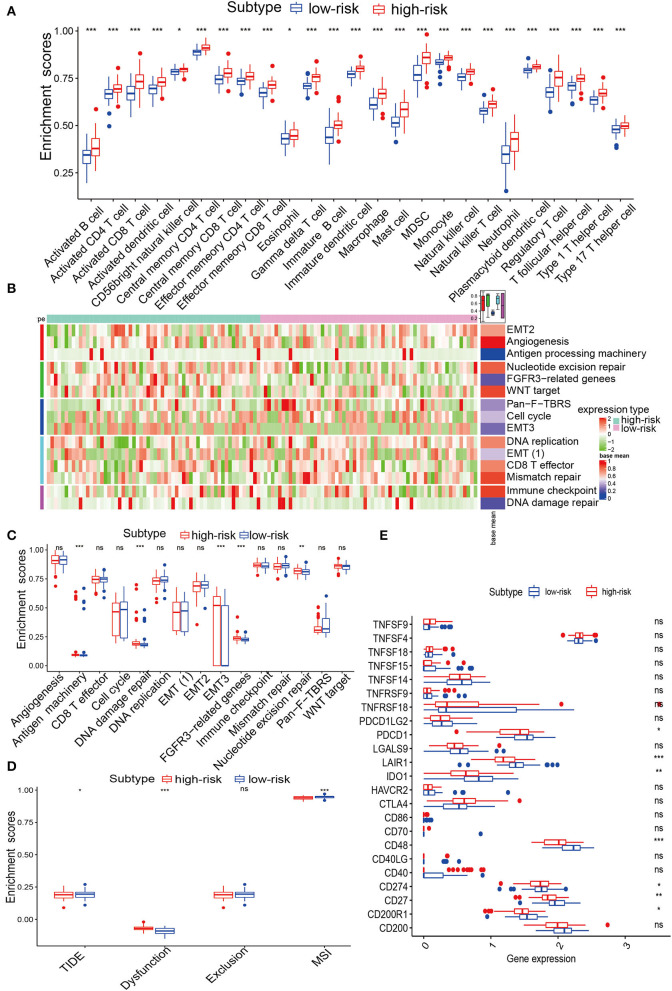
Figure 5.
Immune infiltration analysis of IRPM in TCGA. (A) Abundance differences in immune cells between both groups in the TCGA-GBM cohort. (B) Heatmap showing the distribution of immune pathways in both groups. (C) The abundance of distinction in immune pathways between both groups in the TCGA-GBM cohort. (D) TIDE, MSI, and T cell exclusion and dysfunction score in IRPM. Comparison of scores between IRPM by Wilcoxon test. (E) Quantification of immune checkpoints in both groups in the TCGA-GBM cohort.

