
Fig 3. Single cell RNA sequencing confirms unique FAP population.
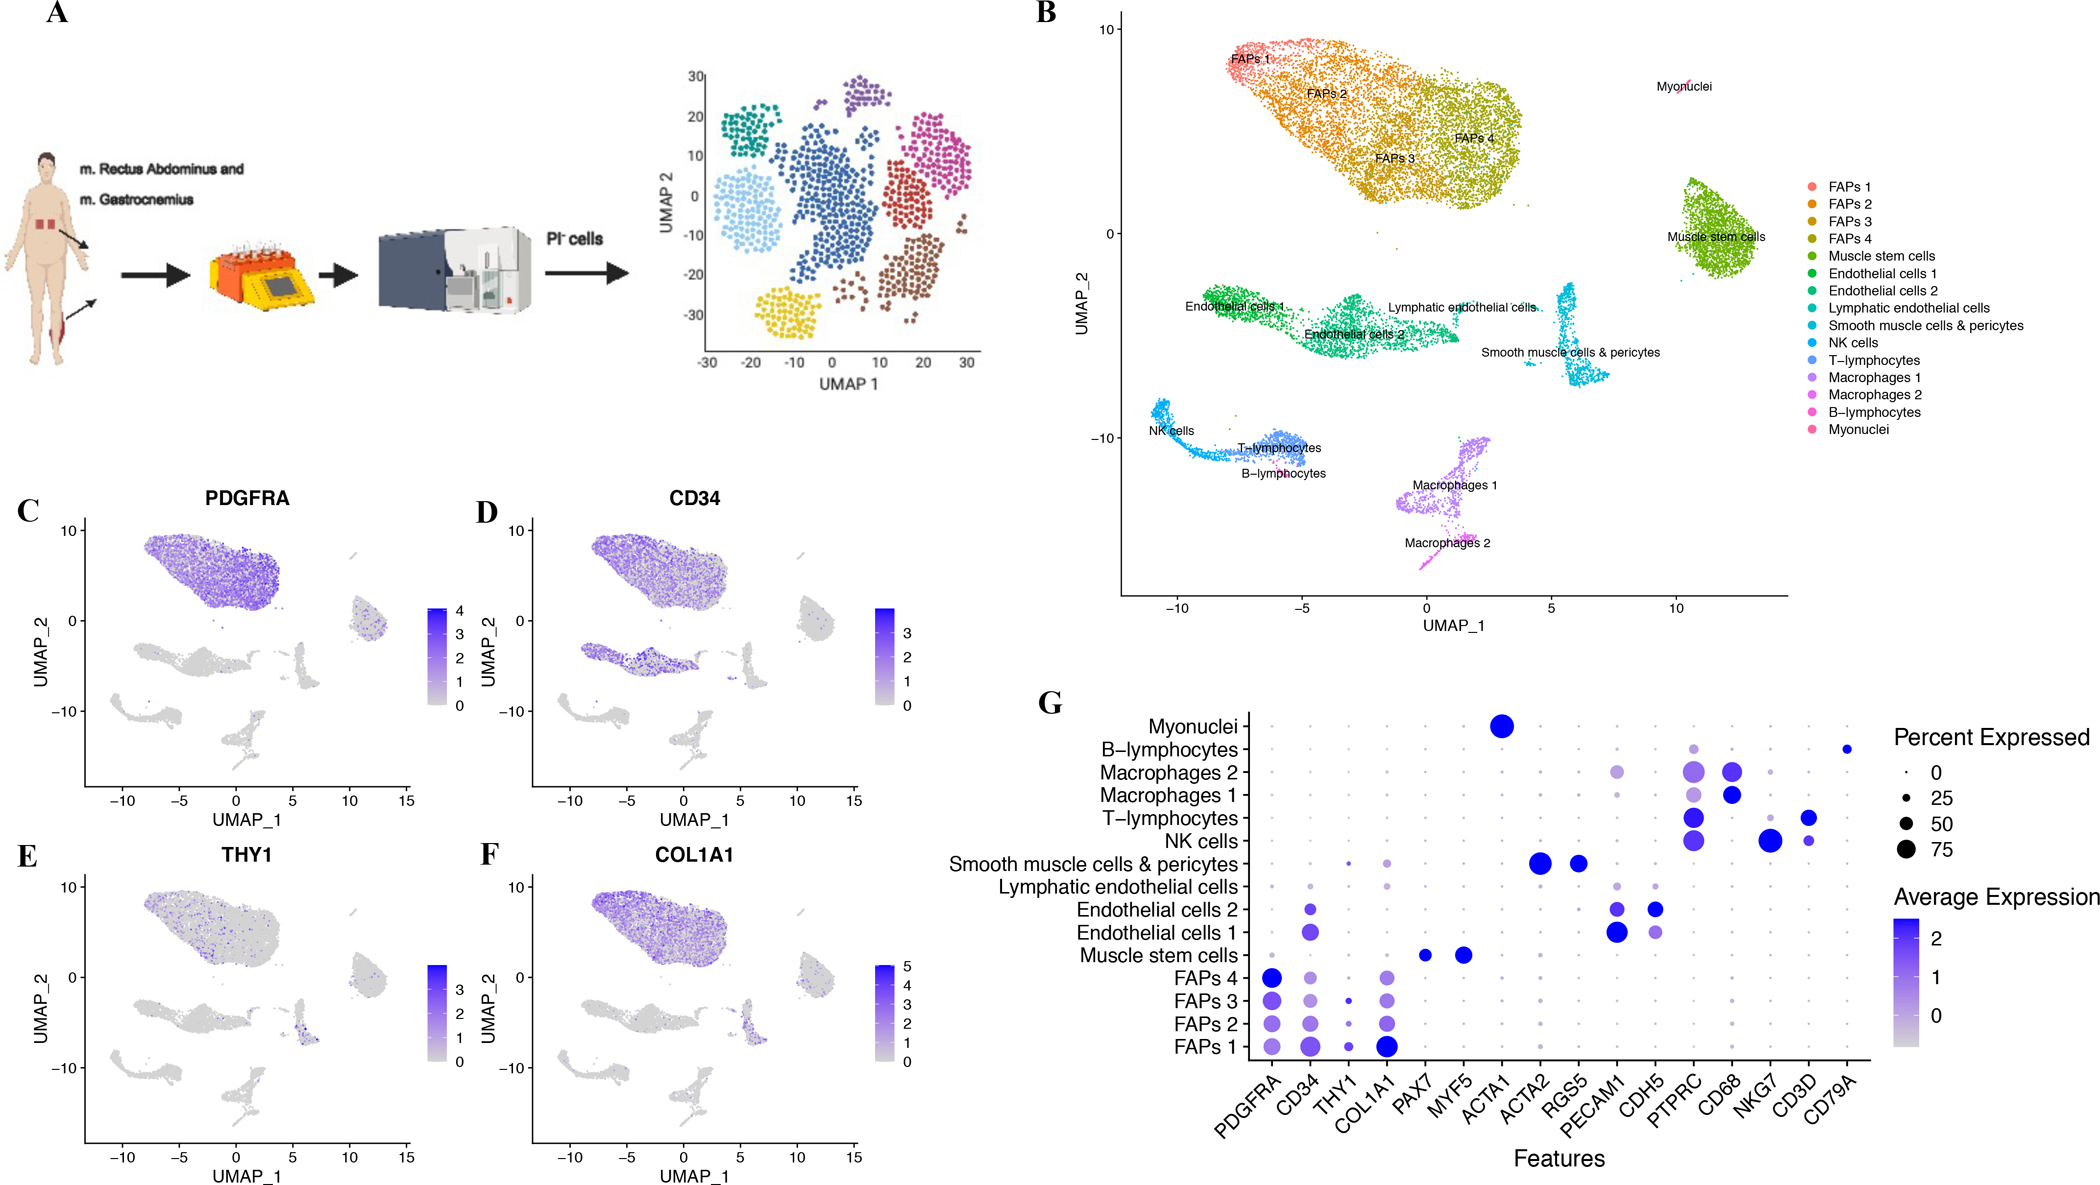
A, Single-cell RNA-seq experiment; B, UMAP clusters (n=4, study 2, 3 non-T2DM and 1 T2DM, mm. Rectus Abdominus/Gastrocnemius) revealed 15 populations; PDGFRA (C), CD34 (D), THY1 (CD90, E), COL1A1 (F) expression; G, canonical cell markers in 15 population, coloring indicates mean expression and dot-size % of cells in which the gene is expressed.