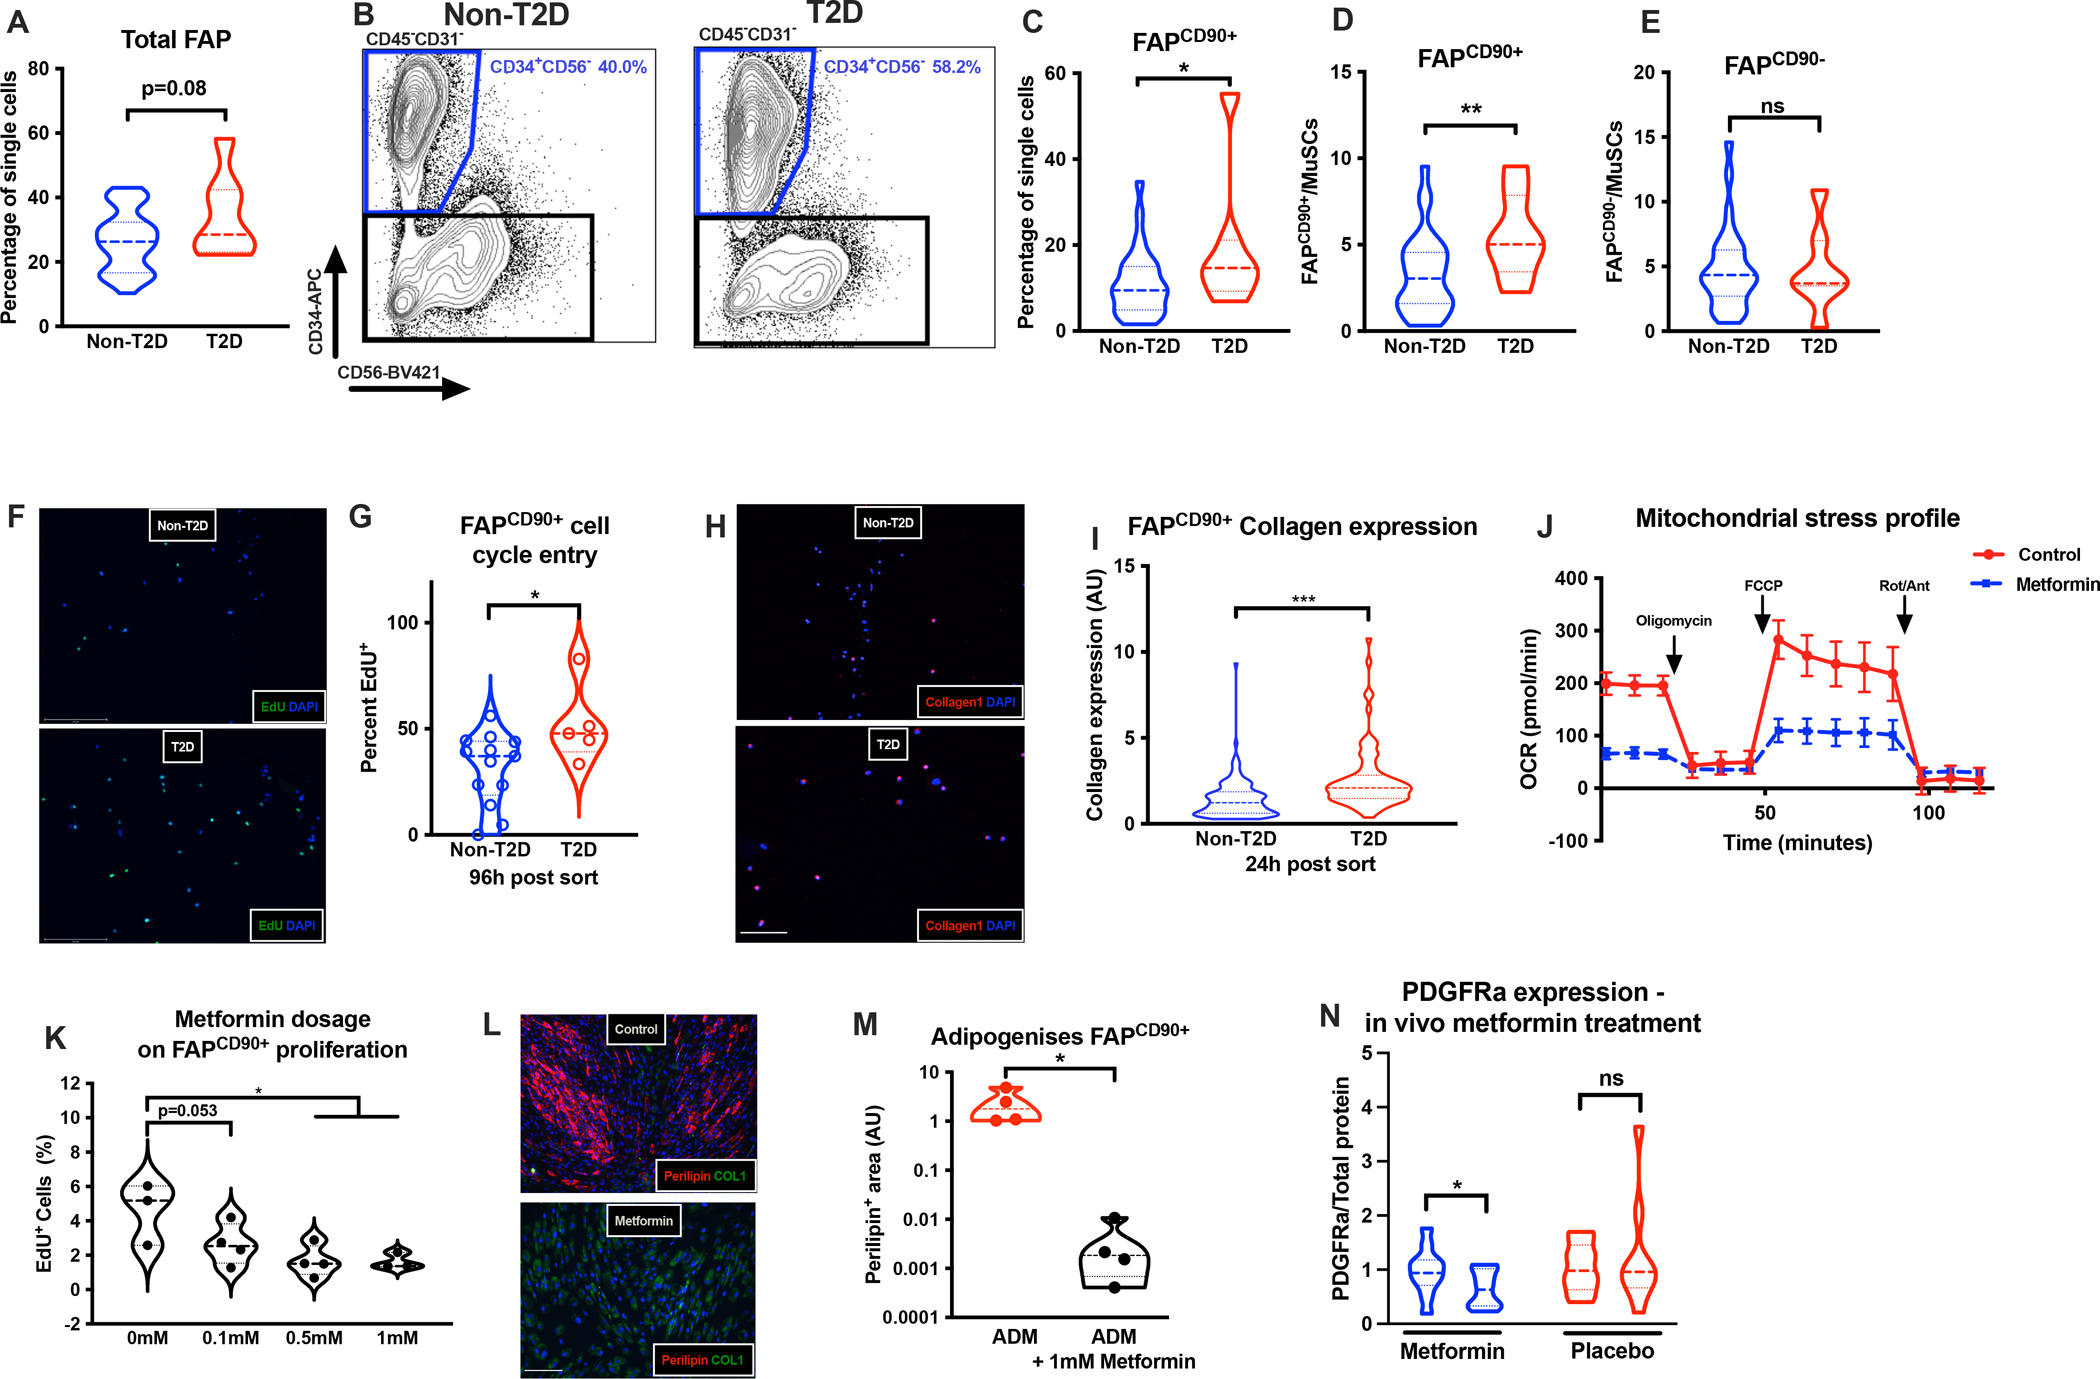
Fig 6. FAPCD90+ accumulate in T2DM and respond to metformin treatment.

A+B, Total FAP content in non-T2DM (n=27–33, study 2) or T2DM (n=7–8) patients; C, % FAPCD90+ in non-T2DM and T2DM patients; D+E, FAPCD90+ and FAPCD90− (per MuSC) content, respectively, in non-T2DM and T2DM; F+G, EdU+ FAPs in non-T2DM and T2DM (n=4–12, study 2); H+I, Collagen1 expression in FAPCD90+ in non-T2DM or T2DM (scalebar 50μm, n=2–3, study 2); J, OCR (pmol/min) on control or metformin treated FAPCD90+ (24h, n=5–6, technical replicates, study 2); K, EdU+ FAPCD90+ following control or 0.1mM, 0.5mM or 1 mM metformin treatment; L-M, Adipogenesis in control or metformin treated FAPCD90+ (scalebar 50μm); N, PDGFRα expression pre/post metformin or placebo treatment (n=11–12, Study 3). Cells from mm. Rectus Abdominus/Gastrocnemius. *p<0.05, ** p<0.01, ***p<0.001.
