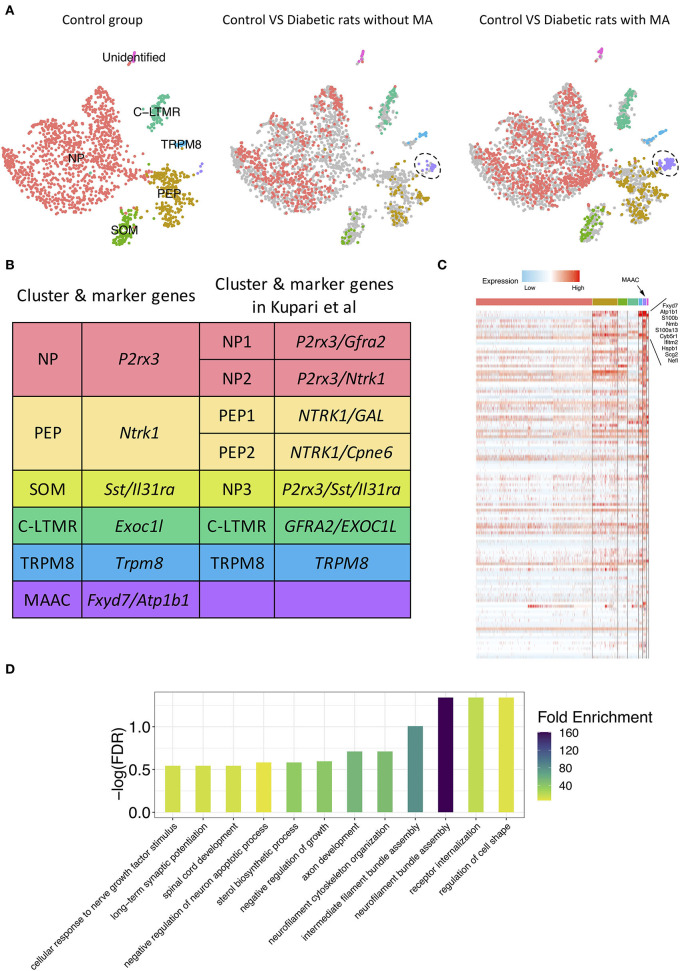
Figure 2.
Novel neuron cluster mechanical allodynia-associated cluster (MAAC) appeared in the development of PDPN. (A) t-SNE plot shows somatosensory neuron clusters in control versus in diabetic rats without or with mechanical allodynia (MA). The dots in the control group are grayed out when they are compared with the dots in the other two groups. Dots, individual cells; colors, neuron clusters. (B) Summary of neuron type classification in this work and previous study. (C) Heatmap shows the DEGs of MAAC. The genes with the largest fold difference are marked. Color, expression level. (D) Bar plot shows gene ontology (GO) terms of biological processes [false discovery rate (FDR) <0.3] enriched for the DEGs of MAAC.

