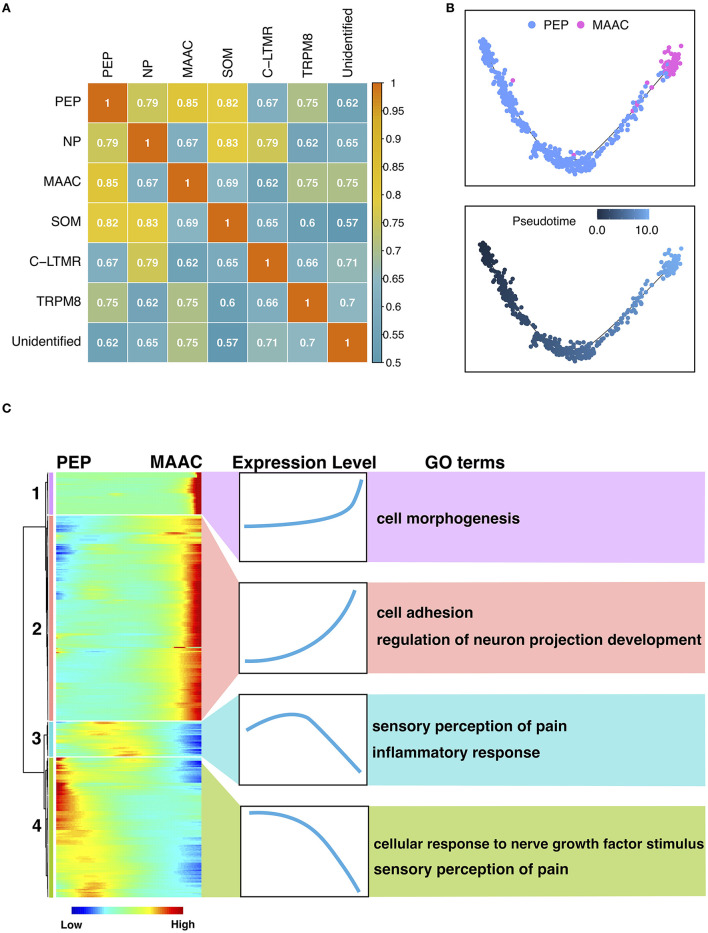
Figure 3.
The origin and transition of MAAC. (A) Heatmap shows the Pearson correlation of each neuron cluster based on their genes expression files. (B) Pseudo-time trajectories show the fate of MAAC originated from peptidergic nociceptors (PEP). Dot, cells; colors, neuron clusters or pseudotime. (C) Heatmaps show the DEGs clustered based on their dynamic expression characteristic, which were shown in pseudo-time from PEP to MAAC.

