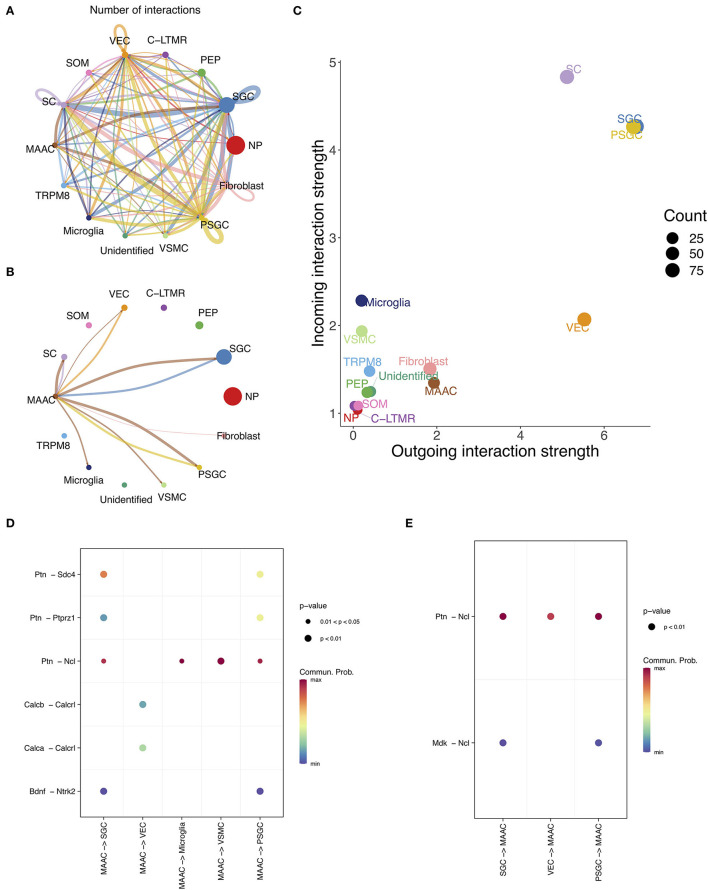
Figure 5.
The intercellular communication of MAAC. (A) Intercellular communication network reflects the number of interactions between clusters. Nodes, neuronal clusters; node size, cell counts; edge width, number of interactions. (B) Intercellular communication network shows the number of interactions between MAAC and other neuron clusters. Nodes, neuronal clusters; node size, cell counts; edge width, number of interactions. (C) Dot plot shows the incoming and outgoing strength of each cell type. The outgoing /incoming interaction strength is defined by the comprehensive communication probability between the signal sending /target cells and all cell types. (D) Dot plot shows the communication probabilities of ligand-receptor pairs when MAAC are sender cells. Only the ligand-receptor pairs with significant changes (p <0.05) are shown in the picture. Commun. Prob, communication probability. The communication probability here equals to the interaction strength and is not exactly a probability. Dot color means communication probabilities and dot size represents computed p-values. (E) Dot plot shows the communication probabilities of ligand-receptor pairs when MAAC serves as target cells.

